Category: Tips & Tricks

The ABC’s of Splunk Part Five: Splunk CheatSheet

Aug 12, 2020 by Sam Taylor

In the past few blogs, I wrote about which environments to choose whether – clustered or standalone, how to configure on Linux,  how to manage the storage over time, and the deployment server.

If you haven’t read our previous blogs, get caught up here! Part 1Part 2Part 3, Part 4

For this blog, I decided to switch it around and provide you with a CheatSheet (takes me back to high school) for the items that you will need through your installation process which are sometimes hard to find. 

This blog will be split into two sections: Splunk and Linux CheatSheets

Splunk CheatSheet:

1: Management Commands

$SPLUNK_HOME$/bin/splunk status – To check Splunk status

$SPLUNK_HOME$/bin/splunk start – To start the Splunk processes

$SPLUNK_HOME$/bin/splunk stop – To stop the Splunk processes

$SPLUNK_HOME$/bin/splunk restart – To restart the Splunk

2: How to Check Licensing Usage

Go to “Settings” > “Licensing”. 

For a more detailed report go to “Settings” > “Monitoring Console” > “Indexing” > “Licence Usage”

3: How to delete index Data: You’re Done Configuring Your Installation But You Have Lots of Logs Going into an Old Indexer and or Data That You No Longer Need But is Taking Space. 

Clean Index Data (Note: you cannot recover these logs once you issue the command)

$SPLUNK_HOME$/bin/splunk clean eventdata -index

If you do not provide -index argument, that will clear all the indexes.

Do to apply this command directly in the clustered environment.

4: Changing your TimeZone (Per User)

Click on your username on the top navigation bar and select “Preferences”.

5:  Search Commands That Are Nice To Know For Beginners

Index=”name of index you’re trying to search. E.g “pan_log” for Palo Alto firewalls”

Sourcetype=”name of sourcetype for the items you are looking for. E.g. “pan:traffic, pan:userid, pan:threat, pan:system”

The following are more examples on how to filter further in your search:

| dedup : allows you to remove all events of similar output –  for instance if you dedup on user and your firewall is generating logs for all user activity, you will not see all the activity of the user, just all the distinct users

| stats: Calculates aggregate statistics, such as average, count, and sum, over the results set

| stats count by rule : Will show you the number of events that matches any specific rule on your firewall

How to get actual event ingestion time?

As most of you may know, the _time field in the events in Splunk is not always the event ingestion time. So, how to get event ingestion time in Splunk? You can get that with the _indextime field.

| eval it=strftime(_indextime, “%F %T”) | table it, _time, other_fields

Search for where the packets are coming to a receiving port 

index=_internal source=*metrics.log tcpin_connections or udpin_connections

Linux CheatSheet:

User Operations

whoami – Which user is active. Useful to verify you are using the correct user to make configuration changes in the backend.

chown -R : – Change the owner of directory.

Directory Operations

mv  – Moving file or directory to new location.

mv  – Renaming a file or directory.

cp  – Copy a file to a new location.

cp -r  – Copy a directory to the new location.

rm -rf  – Remove file or directory.

Get Size

df -h – Get disk usage (in human-readable size unit)

du -sh * – Get the size of all the directories under the current directory.

watch df -h – Monitor disk usage (in human-readable size unit). Update stats every two seconds. Press Ctrl+C to exit.

watch du -sh * – Get size of all the directories under the current directory. Update stats every two seconds. Press Ctrl+C to exit.

Processes

ps -aux – List all the running processes.

top – Get resource utilization statistics by the processes

Work with Files

vi  – Open and edit the file with VI editor

tail -f  – Tail the log file (will display the content of the log file. Unlike cat, touch, or vi it displays the live logs coming to the file.

Networking

ifconfig – To get the IP address of the machine

Written by Usama Houlila.

Any questions, comments, or feedback are appreciated! Leave a comment or send me an email to uhoulila@newtheme.jlizardo.com for any questions you might have.

The ABC’s of Splunk Part Three: Storage, Indexes, and Buckets

Jul 28, 2020 by Sam Taylor

In our previous two blogs, we discussed whether to build a clustered or single Splunk environment and how to properly secure a Splunk installation using a Splunk user.

Read our first blog here

Read our second blog here

For this blog, we will discuss the art of Managing Storage with indexes.conf

In my experience, it’s easy to create and start using a large Splunk environment, until you see storage on your Splunk indexers getting full. What would you do? You start reading about it and you get information about indexes and buckets but you really don’t know what those are. Let’s find out

What is an Index?

Indexes are a logical collection of data. On disk, index data is stored in different buckets

What are Buckets?

Buckets are sets of directories that contain  _raw data (logs), and indexes that point to the raw data organized by age 

Types of Buckets:

There are 4 types of buckets in the Splunk based on the Age of the data

  1. Hot Bucket
    1. Location – homePath (default – $SPLUNK_DB//db)
    2. Age – New events come to these buckets
    3. Searchable – Yes
  2. Warm Buckets
    1. Location – homePath (default – $SPLUNK_DB//db)
    2. Age – Hot buckets will be moved to Warm buckets based on multiple policies of Splunk
    3. Searchable – Yes
  1. Cold Bucket
    1. Location – coldPath (default – $SPLUNK_DB//cold)
    2. Age – warm buckets will be moved to Cold buckets based on multiple policies of Splunk
    3. Searchable – Yes
  1. Frozen Bucket (Archived)
    1. Location – coldToFrozenDir (default – $SPLUNK_DB//cold
    2. Age – Cold buckets can be optionally archived. Archived data are called to be Frozen buckets.
    3. Searchable – No
  1. Thawed Bucket Location
    1. Location – thawedPath (no default)
    2. Age – Splunk does not put any data here. This is the location where archived (frozen) data can be unarchived -we will be covering this topic at a later date
    3. Searchable – Yes
Manage Storage and Buckets

I always like to include the reference materials from which the blog is based upon and the link below has all the different parameters that can be altered whether they should or not. It’s a long read but necessary if you intend to become an expert on Splunk 

https://docs.splunk.com/Documentation/Splunk/8.0.5/Admin/Indexesconf

Continuing with the blog:

Index level settings
  • homePath
    • Path where hot and warm buckets live
    • Default – $SPLUNK_DB//db
    • MyView – As data in Warm and hot bucket are latest and that’s what mostly is being searched. Keep it in a faster storage to get better search performance.
  • coldPath
    • Path where cold buckets are stored
    • Default – $SPLUNK_DB//colddb
    • MyView – As Splunk will move data from the warm bucket to here, slower storage can be used as long as you don’t have searches that span long periods > 2 months
  • thawedPath
    • Path where you can unarchive the data when needed
    • Volume reference does not work with this parameter
    • Default – $SPLUNK_DB//thaweddb
  • maxTotalDataSizeMB
    • The maximum size of an index, in megabytes.
    • Default – 500000
    • MyView – When I started working with Splunk, I left this field as-is for all indexes. Later on, I realized that the decision was ill-advised because the total number of indexes multiplied by the individual size, far exceeded my allocated disk space. If you can estimate the data size in any way, do it at this stage and save yourself the headache 
  • repFactor = 0|auto
    • Valid only for indexer cluster peer nodes.
    • Determines whether an index gets replicated.
    • Default – 0
    • MyView – when creating indexes (on a cluster), set the repFactor = auto so that if you change your mind down the line and decide to increase your resiliency. You can simply edit from the GUI and the change will apply to all your indexes without making manual changes to each one 


And now for the main point of this blog: How do I control the size of the buckets in my tenancy?

Option 1: Control how buckets migrate between hot to warm to cold

Hot to Warm (Limiting Bucket’s Size)

  • maxDataSize = |auto|auto_high_volume
    • The maximum size, in megabytes, that a hot bucket can reach before splunk
    • Triggers a roll to warm.
    • auto – 750MB
    • auto_high_volume – 10GB
    • Default – auto
    • MyView – Do not change it.
  • maxHotSpanSecs
    • Upper bound of timespan of hot/warm buckets, in seconds. Maximum timespan of any bucket can have.
    • This is an advanced setting that should be set with care and understanding of the characteristics of your data.
    • Default – 7776000 (90 days)
    • MyView – Do not increase this value.
  • maxHotBuckets
    • Maximum number of hot buckets that can exist per index.
    • Default – 3
    • MyView – Do not change this.

Warm to Cold

  • homePath.maxDataSizeMB
    • Specifies the maximum size of ‘homePath’ (which contains hot and warm buckets).
    • If this size is exceeded, splunk moves buckets with the oldest value of latest time (for a given bucket) into the cold DB until homePath is below the maximum size.
    • If you set this setting to 0, or do not set it, splunk does not constrain the size of ‘homePath’.
    • Default – 0
  • maxWarmDBCount
    • The maximum number of warm buckets.
    • Default – 300
    • MyView – Set this parameter with care as the number of buckets is very arbitrary based on a number of factors.

Cold to Frozen

When to move the buckets?
  • frozenTimePeriodInSecs [Post this time, the data will be deleted]
    • The number of seconds after which indexed data rolls to frozen.
    • Default – 188697600 (6 years)
    • MyView – If you do not want to archive the data, set this parameter to time for which you want to keep your data. After that Splunk will delete the data.
  • coldPath.maxDataSizeMB
    • Specifies the maximum size of ‘coldPath’ (which contains cold buckets).
    • If this size is exceeded, splunk freezes buckets with the oldest value of the latest time (for a given bucket) until coldPath is below the maximum size.
    • If you set this setting to 0, or do not set it, splunk does not constrain the size of ‘coldPath’.
    • Default – 0
What to do when freezing the buckets?
  • Delete the data
    • Default setting for Splunk
  • Archive the data
    • Please note – If you archive the data, Splunk will not delete the data automatically, you have to do it manually.
    • coldToFrozenDir
      • Archive the data into some other directories
      • This data is not searchable
      • It cannot use volume reference.
    • coldToFrozenScript
      • Script that you can use to ask Splunk what to do to archive the data from cold storage
      • See indexes.conf.spec for more information

Option 2: Control the maximum volume size of your buckets

Volumes

There are only two important settings that you really need to care about.

  • path
    • Path on the disk
  • maxVolumeDataSizeMB
    • If set, this setting limits the total size of all databases that reside on this volume to the maximum size specified, in MB.  Note that this will act only on those indexes which reference this volume, not on the total size of the path set in the ‘path’ setting of this volume.
    • If the size is exceeded, splunk removes buckets with the oldest value of the latest time (for a given bucket) across all indexes in the volume, until the volume is below the maximum size. This is the trim operation. This can cause buckets to be chilled [moved to cold] directly from a hot DB, if those buckets happen to have the least value of latest-time (LT) across all indexes in the volume.
    • MyView – I would not recommend using this parameter if you are having multiple (small and large) indexes in the same volume because now, the size of the volume will decide when the data moves from the hot buckets to the cold buckets irrespective of how important and or fast you need it to be

The Scenario that led to this blog:

Issue

One of our clients has a clustered environment and the hot/warm paths were on SSD drives of limited size (1 TB per indexer) and the coldpath had a 3TB size per indexer. The ingestion rate was somewhere around 60 GB per day across 36+ indexes which resulted in the hot/warm volume to fill up before any normal migration process would occur. When we tried to research the problem and ask the experts, there was no consensus on the best method and I would summarize the answer as follows “It’s an art and different per environment. I.e. we don’t have any advice for you”

Resolution 

We initially started looking for an option to move data to cold storage when data reaches a certain age (time) limit. But there is no way to do that. (Reference – https://community.splunk.com/t5/Deployment-Architecture/How-to-move-the-data-to-colddb-after-30-days/m-p/508807#M17467)

So, then we had two options as mentioned in the Warm to Cold section.

  1. maxWarmDBCount
  2. homePath.maxDataSizeMB

The problem with the maxDataSizeMB setting is that it would impact all indexes which means that some are going to end up in the cold bucket although they are needed in the hot/warm bucket and are not taking space. So we went the warm bucket route because we knew that only three indexes seem to consume most of the storage.  We looked at those and found that they were containing 180+ warm buckets.

We reduced maxWarmDBCount to 40 for these large indexes only and the storage size for the hot and warm buckets normalized for the entire environment.

For our next blog, we will be discussing how to archive and unarchive data in Splunk


Written by Usama Houlila.

Any questions, comments, or feedback are appreciated! Leave a comment or send me an email to uhoulila@newtheme.jlizardo.com for any questions you might have.

If you wish to learn more, click the button below to schedule a free consultation with Usama Houlila.

The ABC’s of Splunk Part One: What deployment to Choose

Jul 15, 2020 by Sam Taylor

When I first started working with Splunk, I really didn’t understand the nuanced differences between a Clustered environment and a standalone other than the fact that one is much more complex and powerful than the other. In this blog, I’m going to share my experience of the factors that need to be considered and what I learned throughout the process. 

Let’s start with the easy stuff:
  1. Do you intend to run Enterprise Security? If you are, clustered is the way to go unless you are a very small shop (less than 10GB/day of ingestion)

  2. How many log messages, systems, and feeds will you configure? If you intend to receive in excess of 50GB/day of logs, you will need a clustered environment. You can potentially get away with a standalone but your decision will most likely change to a clustered environment over time as your system matures and adds the necessary alerts and searches

Now, moving on to the harder items:
  • How about if I’m receiving less than 50GB/day: In this scenario, it will depend primarily on the following factors:

    • Number of Users: Splunk allocates 1 CPU core for each search being executed. Increasing the number of users will also increase the number of searches in your deployment. On average, If <10, then standalone, otherwise clustered

    • Scheduled Saved-searches, Reports, and Alerts:  How many alerts do you intend to configure, and how frequently will they run the searches? If less than 30, then a standalone will work, but more will require a clustered environment especially if the alerts/searches are running every 5 minutes

    • How many  cloud tenancies are you going to be pulling logs from AWS, O365, GSuite, Sophos, and others collect lots of logs and if you have more than 5 of these to pull logs from, I would choose a clustered environment over a standalone (the larger your user environment, the more logs you will be collecting from your cloud tenancies)

    • How many systems are you pulling the logs from? If you have in excess of 70 systems, I would choose a clustered environment over standalone

    • Finally, Is your organization going to grow? I assume you know the drill here

A recent “how-to” question came from a Splunk user that is pertinent to this blog ”What if I want to build a standalone server because the complexity of the clustered environment is beyond my abilities, and my deployment based on the items above marginally requires a clustered environment, is there something I can do?”

The simple answer is yes, there are two things that will make a standalone environment work in this scenario:

  1. Add more memory and CPUs which you can always do after the fact: (look at the specs of the standalone server at the bottom of the document)

  2. Add a heavy forwarder: Heavy forwarders can handle the initial incoming traffic to your Splunk from all the different feeds and cloud tenancies which will help the Splunk platform dedicate the resources to acceleration, searches, dashboards, alerts/reports, etc.

Finally, it’s important to note that a clustered environment has a replication factor that can be used to recover data in case a single indexer fails and or the data on it is lost

Important Note when using Distributed Architecture:

Network latency plays an important role in a distributed/clustered environment, therefore, minimal network latency between your indexers and search heads will ensure optimal performance.

Hardware Requirements

Standalone Environment (Single Instance)

Splunk Recommended Hardware Configuration
  • Intel x86 64-bit chip architecture

  • 12 CPU cores at 2Ghz or greater speed per core

  • 12GB RAM

  • Standard 64-bit Linux or Windows distribution

  • Storage Requirement – Calculate Storage Requirement

View Reference Here

Standalone Environment with a separate Heavy Forwarder

Hardware Configuration
  • Same as Standalone hardware requirement for both the Standalone Instance and the Heavy Forwarder, however, the heavy forwarder does not store data and therefore you can get away with a 50 or 100 GB drive partition

Distributed Clustered Architecture

Distributed Architecture will have the following components:
  • Heavy Forwarder – Collects the data and forwards it to Indexers.

  • Indexers – Stores the data and performs a search on that data (3 or more)

  • Search Head – Users will interact here. The search head will trigger the search on indexers to fetch the data.

  • Licensing Server

  • Master Cluster Node

  • Deployment Server

Search Head hardware requirements

  • Intel 64-bit chip architecture

  • 16 CPU cores at 2Ghz or greater speed per core

  • 12GB RAM

  • A 1Gb Ethernet NIC

  • A 64-bit Linux or Windows distribution

Indexer requirements

  • Intel 64-bit chip architecture

  • 12 CPU cores at 2GHz or greater per core

  • 12GB RAM

  • 800 average IOPS as a minimum for the disk subsystem. For details, see the topic Disk subsystem. Refer Calculate Storage Requirement see how much storage will your deployment need

  • A 1Gb Ethernet NIC

  • A 64-bit Linux or Windows distribution

Heavy Forwarder requirements

  • Intel 64-bit chip architecture

  • 12 CPU cores at 2Ghz or greater speed per core.

  • 12GB RAM

  • A 1Gb Ethernet NIC

  • A 64-bit Linux or Windows distribution

Deployment/Licensing/Cluster Master requirements

  • Intel 64-bit chip architecture

  • 12 CPU cores at 2GHz or greater per core

  • 12GB RAM

  • A 1Gb Ethernet NIC

  • A 64-bit Linux or Windows distribution

View Reference Here

Calculate Storage Requirements

Splunk will compress the data that you are ingesting. At a very high-level, Splunk’s compressed data to almost half the size, so for your standalone environment, you can calculate storage requirements with the below equation.

( Daily average indexing rate ) x ( retention policy in days ) x 1/2

For or your clustered environment, you can calculate storage requirements for each indexer with the below equation.

((( Daily average indexing rate ) x ( retention policy in days ) x 1/2) x replication factor)) / No. of Indexers)
View Reference Here

Written by Usama Houlila.

Any questions, comments, or feedback are appreciated! Leave a comment or send me an email to uhoulila@newtheme.jlizardo.com for any questions you might have.

If you wish to learn more, click the button below to schedule a free consultation with Usama Houlila.

Beware “Phishy” Emails

Jun 18, 2020 by Sam Taylor

By Wassef Masri

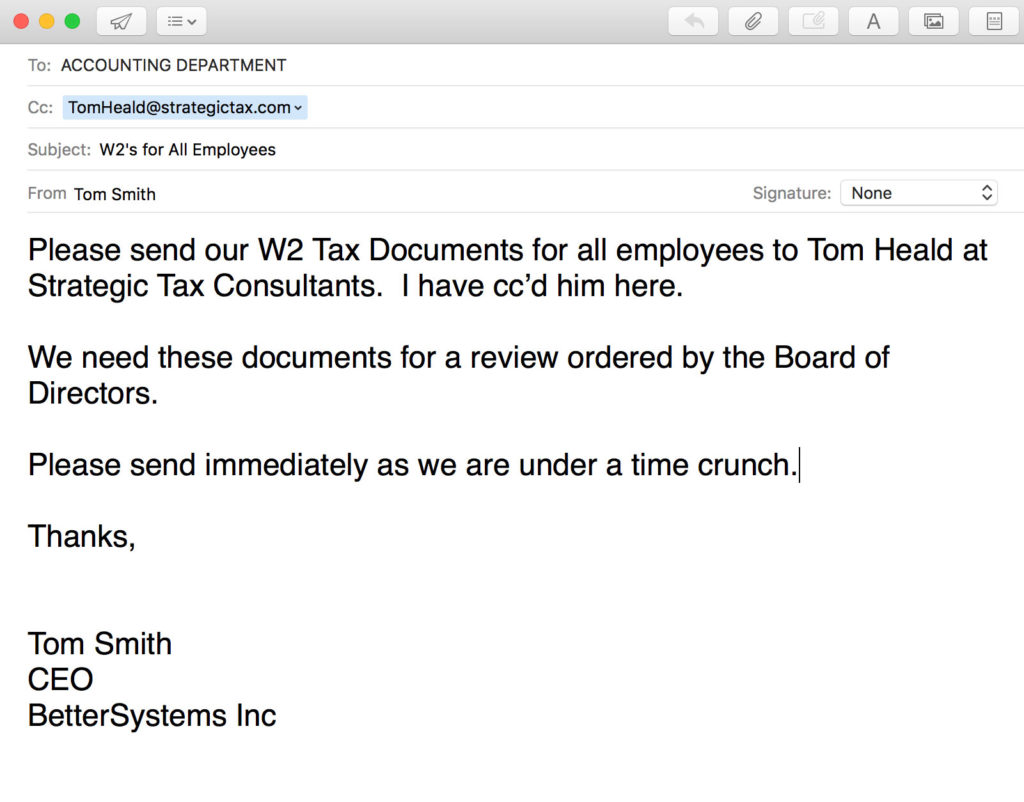
When the accounting manager at a major retail US company received an email from HR regarding harassment training, he trustingly clicked on the link. Had he looked closer, he could’ve caught that the source was only a look-alike address. Consequently, he was spear-phished.

The hackers emailed all company clients and informed them of a banking account change. The emails were then deleted from the “sent” folder. By the time the scam was discovered a month later, $5.1 Million were stolen.

As in the previous crisis of 2008, cyber-crime is on the rise. This time however, hackers are higher in numbers and more refined in techniques. Notably, the emergence of malware-as-a-service offerings on the dark web is giving rise to a class of non-technical hackers who are better at marketing and social engineering skills.

Phishing emails are the most common attack vector and are often the first stage of a multi-stage attack. Most organizations today experience at least one attack a month.

What started as “simple” phishing that fakes banking emails has evolved into three types of attacks that increase in sophistication:

  • Mass phishing: Starts with a general address (e.g. “Dear customer”) and impersonates a known brand to steal personal information such as credit card credentials.
  • Spear phishing: More customized than mass phishing and addresses the target by his/her name, also through spoofed emails and sites.

  • Business Email Compromise (BEC): Aka CEO fraud, is more advanced because it is sent from compromised email accounts, making them harder to uncover. They mostly target company funds.

How to Protect Against Phishing?

While there is no magical solution, best practices are multi-level combining advanced technologies with user education:

1. User awareness: Frequent testing campaigns and training.

2. Configuration of email system to highlight emails that originate from outside of the organization

3. Secure email gateway that blocks malicious emails or URL’s. It includes:

  • Anti-spam
  • IP reputation filtering
  • Sender authentication
  • Sandboxing
  • Malicious URL blocking

4. Endpoint security: The last line of defense; if the user does click a malicious link or attachment, a good endpoint solution has:

  • Deep learning: blocks new unknown threats
  • Anti-exploit: stops attackers from exploiting software vulnerabilities
  • Anti-ransomware: stops unauthorized encryption of company resources

It is not easy to justify extra spending especially with the decrease in IT budgets projected for 2020. It is essential however to have a clear strategy to prioritize action and to involve organization leadership in mitigating the pending threats.

Leave a comment or send an email to wmasri@newtheme.jlizardo.com for any questions you might have!

Tips and Tricks with MS SQL (Part 10)

Mar 26, 2020 by Sam Taylor

Cost Threshold for Parallelism? A Simple Change to Boost Performance

Many default configuration values built-in to Microsoft SQL Server are just long-standing values expected to be changed by a DBA to fit their current environment’s needs. One of these configs often left unchanged is “Cost Threshold for Parallelism” (CTFP). In short, this determines, based on determined query cost (i.e.. estimated workload of a query plan) it’s availability to execute in parallel with multiple CPU threads. A higher CTFP value limits queries to run parallel unless it’s cost exceed the set value.  

Certain queries may be best suited to run on single-core performance, while others would benefit more from parallel multi-core execution. The determination of this is based on many variables, including the physical hardware, type of queries, type of data, and many other things. The good news is that SQL’s Query Optimizer helps makes these decisions by using those queries’ “cost” based on the query plan they execute. Cost is assigned by the cardinality estimator.. more on that later.

Here’s our opportunity to optimize the default CTFP value of 5. The SQL Server algorithm (cardinality estimator) that determines query plan cost changed significantly from SQL Server 2012 to present day SQL Server 2016+. Increasing this value to a higher number will allow the query to run via single-core performance which is generally faster than multi-core performance (referencing the top commercial grade CPUs). The common consensus on almost every SQL tuning website, including Microsoft’s own docs, suggests this value should be increased; common agreement as the value of 20 to 30 being a good starting point. Compare your current query plan execution times, increase CTFP, compare new times, and repeat until the results are most favorable.

Since my future blog posts in this series will become more technical, right now’s a perfect time to get your feet wet. Here’s two different methods you can use to make these changes.

Method 1: T-SQL

Copy/Paste the following T-SQL into a new query Window:

            USE [DatabaseName] ; — This database where this will be changed.

            GO

            EXEC sp_configure ‘show advanced options’ , 1 ; — This enables CTFP to be changed

            GO

            RECONFIGURE

            GO

            EXEC sp_configure ‘cost threshold for parallelism’, 20 ; — The CTFP value will be 20 here

            GO

            RECONFIGURE

            GO

Method 2: GUI

To make changes via SQL Server Management Studio:

            1. In Object Explorer – Right Click Instance – Properties – Advanced – Under “Parallelism” change value for “Cost Threshold for Parallelism” to 20

            2. For changes to take effect, open a query window a run “RECONFIGURE” and execute query.

If you’d like to learn how to see query plan execution times, which queries to compare, and how to see query costs, leave a comment or message me. Keep a look out for my next post which will include queries to help you identify everything I’ve covered in this blog series so far. Any questions, comments, or feedback are appreciated! Leave a comment or send me an email to aturika@newtheme.jlizardo.com for any SQL Server questions you might have!

Tips and Tricks With MS SQL (Part 9)

Mar 18, 2020 by Sam Taylor

Backups Need Backups

This week I’ve decided to cover something more in the style of a PSA than dealing with configurations and technical quirks that help speed up Microsoft SQL servers. The reason for the change of pace is from what I’ve been observing lately. It’s not pretty.

Backups end up being neglected. I’m not just pointing fingers at the primary backups, but where are the backup’s backups? The issue here is – what happens when the primary backups accidentally get deleted, become corrupt, or the entire disk ends up FUBAR? This happens more often than people realize. A disaster recovery plan that doesn’t have primary backups replicated to an offsite network or the very least in an isolated location is a ticking time bomb.

A healthy practice for the primary backups is to verify the integrity of backups after they complete. You can have Microsoft SQL Server perform checksum validation before writing the backups to media. This way if the checksum value for any page doesn’t exactly match that which is written to the backup, you’ll know the backup is trash. This can be done via scripts, jobs, or via manual backups. Look for the “Media” tab when running a backup task in SQL Server Management Studio. The two boxes to enable are “Verify backup when finished” and “Perform checksum before writing to media”.

It’s true we’re adding extra overhead here and might take backups a bit longer to finish. But I’ll leave it up to you to decide if the extra time is worth having a working backup you can trust to restore your database or a broken backup wasting precious resources. For the sake of reliability, if you decide time is more important, then at least have a script perform these reliability checks on a regular basis or schedule regular restores to make sure they even work.

If you follow this advice you can rest easy knowing your data can survive multiple points of failure before anything is lost. If the server room goes up in flames, you can always restore from the backups offsite. If you need help finding a way to have backup redundancy, a script to test backup integrity, or questions about anything I covered feel free to reach out. Any questions, comments, or feedback are always appreciated! Leave a comment or send me an email to aturika@newtheme.jlizardo.com for any SQL Server questions you might have!

Helpful Tips for Remote Users in the Event of a Coronavirus Outbreak

Mar 3, 2020 by Sam Taylor

Remember: Planning ahead is critical.

In response to recent news, we have a few reminders to assist with your remote access preparedness to minimize the disruption to your business. 

Remote Access

Make sure your users have access to and are authorized to use the necessary remote access tools, VPN and/or Citrix.  If you do not have a remote access account, please request one from your management and they can forward their approval to IT.

Email

If you are working from home and are working with large attachments, they can also be shared using a company approved file sharing system such as Office 365’s OneDrive, Dropbox or Citrix Sharefile. Make sure you are approved to use such service and have the relevant user IDs and passwords.  Its best to test them out before you need to use them. Make sure to comply with any security policies in effect for using these services.

Office Phone

Ensure continued access to your 3CX office phone by doing either of these things:

  1. Installing the 3CX phone software on your laptop, tablet or smartphone
  2. Forward your calls to your cell or home phone. Remember you can also access your work voice mail remotely. 

Virtual Meetings

Web meetings or video conferences become critical business tools when working remotely.  Make sure you have an account with your company web meeting/video service, with username and password.  It is a good idea to test it now to ensure your access is working correctly.

Other Recommendations

Prepare now and notice the information and supplies you need on a daily basis.  Then bring the critical information and supplies home with you in advance so you have them available in the event you need to work remotely.  Such items may include:

  1. Company contact information including emergency contact info (including Phone numbers)

  2. Home office supplies such as printer paper, toner and flash drives.

  3. Mailer envelopes large enough to send documents, etc.

  4. Make note of the closest express mailing location near your home and company account information if available

CrossRealms can help set up and manage any or all of the above for you so you can focus on your business and customers.

If you are a current CrossRealms client, please feel free to contact our hotline at 312-278-4445 and choose No.2, or email us at techsupport@newtheme.jlizardo.com

We are here to help!

Tips and Tricks with MS SQL (Part 8)

Dec 23, 2019 by Sam Taylor

Tame Your Log Files!

By default, the recovery model for database backups on Microsoft‘s SQL Server is set to “full”. This could cause issues for the uninitiated. If backups aren’t fully understood and managed correctly it could cause log files to bloat in size and get out of control. With the “full” recovery model, you get the advantage of flexibility in point-in-time restores and high-availability scenarios, but this also means having to run separate backups for log files in addition to the data files.


To keep things simple, we’ll look at the “simple” recovery model. When you run backups, you’re only dealing with data backups whether it’s a full or differential backup. The log file, which holds transactions between full backups, won’t be something you need to concern yourself with unless you’re doing advanced disaster recovery, like database mirroring, log shipping, or high-availability setups.


When dealing with a “full” recovery model, you’re not only in charge of backing up the data files, but the log files as well. In a healthy server configuration, log files are much smaller than data files. This means you can run log backups every 15 minutes or every hour without much IO activity as a full or differential backup. This is where you get the point-in-time flexibility. This is also where I often see a lot of issues…


Log files run astray. A new database might be created or migrated, and the default recovery model is still in “full” recovery mode. A server that relies on a simpler setup might not catch this nor have log backups in place. This means the log file will start growing exponentially, towering over the data file size, and creating hordes of VLFs (look out for a future post about these). I’ve seen a lot of administrators not know how to control this and resort to shrinking databases or files – which is just something you should never do unless your intentions are data corruption and breaking things.


My advice here is keep it simple. If you understand how to restore a full backup, differential backups, and log backups including which order they should be restored in and when to use “norecovery” flags,  or have third-party software doing this for you, you’re all set. If you don’t, I would suggest setting up log backups to run at regular and short interval (15 mins – 1 hour) as a precaution and changing the database recovery models to “simple”. This can keep you protected when accidentally pulling in a database that defaulted to the “full” recovery model and having its log file eat the entire disk.


Pro Tip: Changing your “model” database’s recovery model will determine the default recovery model used for all new databases you create.


Any questions, comments, or feedback are appreciated! Leave a comment or send me an email to aturika@newtheme.jlizardo.com for any SQL Server questions you might have!

Tips and Tricks with MS SQL (Part 7)

Dec 6, 2019 by Sam Taylor

Quickly See if Ad Hoc Optimization Benefits Your Workloads​

A single setting frequently left disabled can make a huge performance impact and free up resources. The setting is a system-wide setting that allows Microsoft SQL Server to optimize it’s processes for “Ad Hoc” workloads. Most SQL Servers I come across that rely heavily upon ETL (Extract – Transform – Load) workloads for their day-to-day would benefit from enabling “Optmize for AdHod Workloads” but often don’t have the setting enabled.

If you perform a lot of ETL workloads and want to know if enabling this option will benefit you, I’ll make it simple. First we need to determine the percentage of your cache plan that runs Ad Hoc. To do so just run the following T-SQL script in SQL Server Management Studio:

SELECT AdHoc_Plan_MB, Total_Cache_MB,

        AdHoc_Plan_MB*100.0 / Total_Cache_MB AS ‘AdHoc %’

FROM (

SELECT SUM(CASE

            WHEN objtype = ‘adhoc’

            THEN size_in_bytes

            ELSE 0 END) / 1048576.0 AdHoc_Plan_MB,

        SUM(size_in_bytes) / 1048576.0 Total_Cache_MB

FROM sys.dm_exec_cached_plans) T

After running this, you’ll see a column labelled “AdHoc %” with a value. As a general rule of thumb, I prefer to enable optmizing for Ad Hoc workloads when these values are between 20-30%. These numbers will change depending on the last time the server was reset so it’s best to check after the server has been running for at least a week or so. Changes only go into affect for new cached plans created. For the impatient, a quicker way to see the results of the change require restarting SQL Services to clear the plan cache.

Under extremely rare circumstanes this could actually hinder performance. If that’s the case just disable Ad Hoc and continue on as you were before. As always, feel free to ask me directly so I can help. There isn’t any harm in testing if this benefits your environment or not. To enable optmiziation, right click the SQL Instance from SQL Server Management Studio’s Object Explorer à Properties à Advanced à Change “Optmize for Ad Hoc Workloads” to “True” à Click “Apply”. From there run the query “RECONFIGURE” to put the change into action.

Any questions, comments, or feedback are appreciated! Leave a comment or send me an email to aturika@newtheme.jlizardo.com for any SQL Server questions you might have!

Tips and Tricks with MS SQL (Part 6)

Dec 6, 2019 by Sam Taylor

Increase the Number of TEMPDB Data Files

If you’re having issues with queries that contain insert/update statements, temp tables, table variables, calculations, or grouping or sorting of data, it’s possible you’re seeing some contention within the TEMPDB data files. A lot of Microsoft SQL servers I come across only have a single TEMPDB data file. That’s not a Best Practice according to Microsoft. If you have performance issues when the aforementioned queries run it’s a good idea to check on the number of TEMPDB files you have because often times just one isn’t enough.


SQL Server places certain locks on databases, including TEMPDB, when it processes queries. So, if you have 12 different databases all running queries with complex sorting algorithms and processing calculations of large datasets, all that work is first done in TEMPDB. A single file for TEMPDB doesn’t only hurt performance and efficiency but can also slow down other processes running alongside it by hogging resources and/or increased wait times. Luckily, the resolution is super simple if you’re in this situation.


Increase the number of data files in TEMPDB to maximize disk bandwidth and reduce contention. As Microsoft recommends, if the number of logical processors is less than or equal to 8 – that’s the number of data files you’ll want. If the number of logical processors is greater than 8, just use 8 data files. If you’ve got more than 8 logical processors and still experience contention, increase the data files by multiples of 4 while not exceeding the number of logical processors. If you still have contention issues, consider looking at your workload, code, or hardware to see where improvements can be mode.


PRO TIP: When you increase the number of your TEMPDB data files (on its separate drive… remember?) take this time to pre-grow your files. You’ll want to pre-grow all the data files equally and enough to take up the entire disk’s space (accounting for TEMPDB’s log file).


Any questions, comments, or feedback are appreciated! Leave a comment or send me an email to aturika@newtheme.jlizardo.com for any SQL Server questions you might have!