Category: CrossRealms

ABCs of Splunk, Part 8: Advanced Search

Sep 2, 2020 by Sam Taylor

In this post, we will continue our journey into search with Splunk and add a few more commands to include in your arsenal of knowledge. Please revisit our previous posts to ensure you have a healthy environment upon which to run commands.

Prerequisite

How to Install Splunk on Linux

Upload data required for the examples in this post.

  1. Download Tutorials.zip and Prices.csv.zip to your machine.
  2. Log in to Splunk Web. Go to Settings. On the settings page click on Add Data in the left pane.
  1. On the Add Data page click on the Upload
  2. On the file upload page select or drag and drop files/archives that you have downloaded (one-by-one). You do not have to extract the archive.
  3. After the upload is finished click on Next
  4. Select the source type as “Auto.”
  5. In the Host name extract field, use the Segment with value as 1 if you have Splunk running on Linux system. If you have Splunk running on Windows system use regular expression-based extract with regex value as \\(.*)\/.
  6. Create and select a new Index “test.”
  7. Complete the upload for both the files.

Searching and filtering

Commands in this category are used to search for various events and apply filters on them by using some pre-defined criteria.

Searching and filtering commands:

  • Search
  • Dedup
  • Where
  • Eval

Search

The search command is used to retrieve events from indexes or to filter the results of a previous search command in the pipeline. 

You can retrieve events from your indexes by using keywords, quoted phrases, wildcards and key/value expressions. 

The search command is implied at the beginning of any search. You do not need to specify the search command at the beginning of your search criteria.

Order does not matter for criteria.

index=test host=www*

Is the same as

host=www* index=test

Quotes are optional for search command, but you must put quotes when the values contain spaces.

index=test host=”Windows Server”

Dedup

The dedup command removes the events that contain an identical combination of values for the fields that you specify. 

With dedup, you can specify the number of duplicate events to keep for each value of a single field or for each combination of values among several fields. Events returned by dedup are based on search order.

Remove duplicate search results with the same host value.

index=test | dedup host

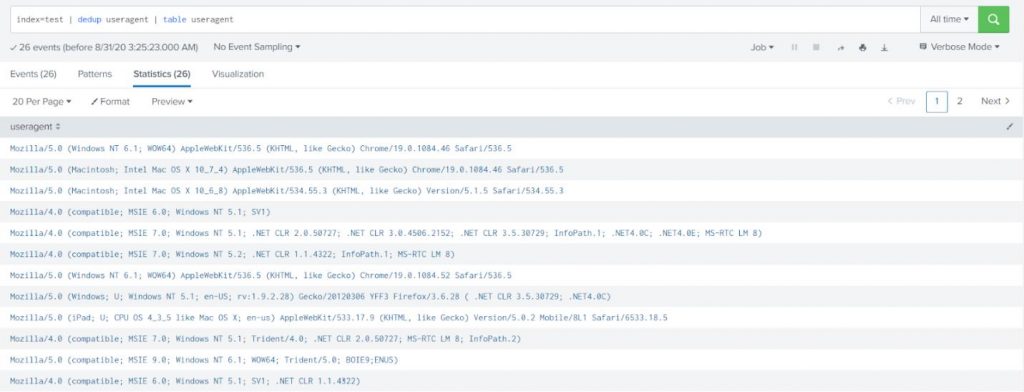
Get all user agents under index test.

index=test | dedup useragent | table useragent

Where

The where command performs arbitrary filtering on the data and uses eval expressions to filter search results. The search keeps only the results for which the evaluation was successful (that is, the Boolean result = true).

The where command uses the same expression syntax as the eval command. Also, both commands interpret quoted strings as literals. If the string is not quoted it is treated as a field name. Use the where command when comparing two different fields, as this cannot be done by using the search command.

Command

Example

Description

Where

… | where foo=bar

This search looks for events where the field foo is equal to the field bar.

Search

| search foo=bar

This search looks for events where the field foo contains the string value bar.

Where

… | where foo=”bar”

This search looks for events where the field foo contains the string value bar.

Example-1:

Find the events with ProductID starts with the value WC-SH-A.

index=test | where like(productId, “WC-SH-A%”)

You can only specify a wildcard (% sign) with the where command by using the “like” function. 

Example-2:

Search the events with failed HTTP response (HTTP response status can be found with field name status).

index=test | where status!=200

Eval

The eval command is used to add new fields in the event by using existing fields from the event and arbitrary expressions. The eval command calculates an expression and puts the resulting value into a search results field.

If the field name that you specify does not match a field in the output, then a new field is added to the search results.

If the field name you specify matches a field name that already exists in the search results, then the results of the eval expression overwrite the values for that field.

The eval command evaluates mathematical, string, and boolean expressions.

Example-1:

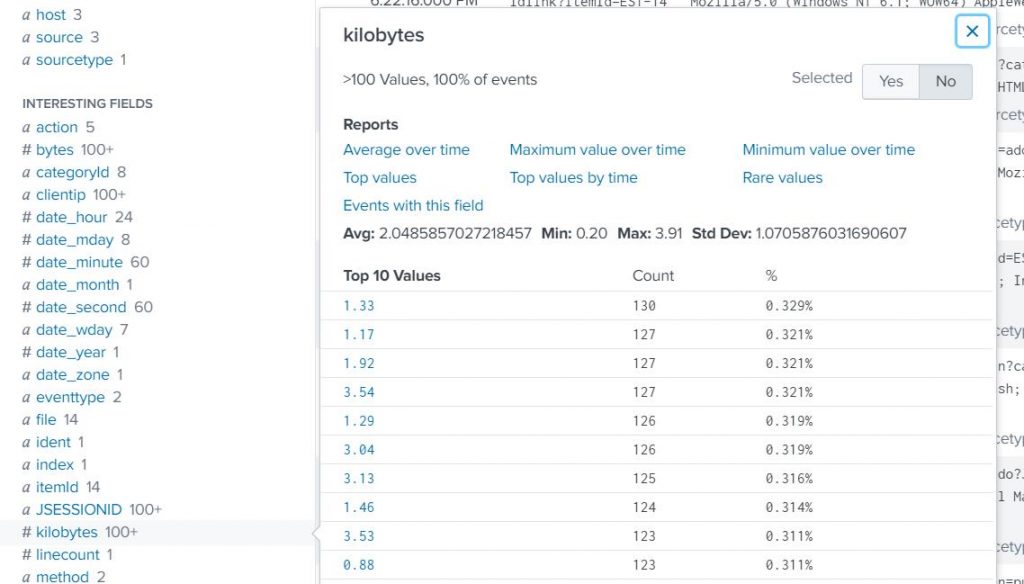
Convert the response size from bytes into kilobytes (tutorials data (sourcetype=access*) consisting of web server logs that contain a field named bytes, which represents the response size).

index=test sourcetype=access* | eval kilobytes=round(bytes/1024,2)

Example-2:

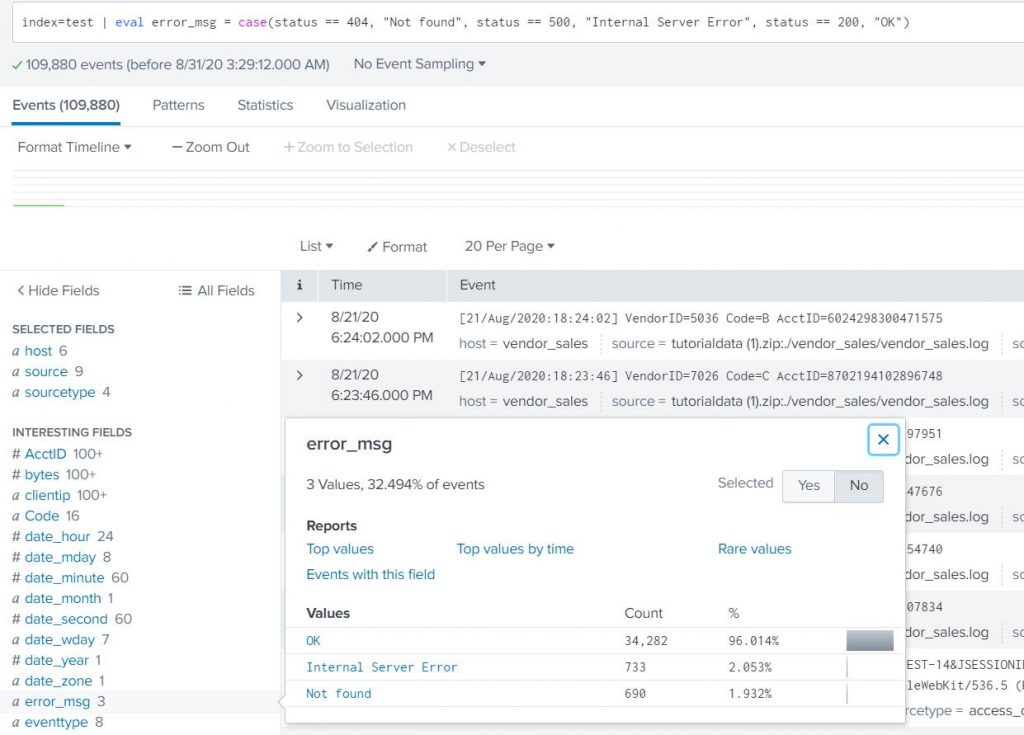
Create a field called error_msg in each event. Distinguish the requests based on the status code. Status 200 is okay, 404 is page not found, 500 is an internal server error (hint – use case statement with field status).

index=test | eval error_msg = case(status == 404, “Not found”, status == 500, “Internal Server Error”, status == 200, “OK”)


Formatting and ordering

These commands are used to reformat the search results and order them based on the field values.

Formatting and ordering commands:

  • Rename
  • Table and Fields
  • Sort

Rename

The rename command is used to rename one or more fields and is useful for giving fields more meaningful names, such as Process ID instead of pid

If you want to rename fields with similar names, you can use a wildcard character.

You cannot rename one field with multiple names. For example, if you have field A, you cannot specify | rename A as B, A as C.

Renaming a field can cause loss of data. Suppose you rename field A to field B, but field A does not exist. If field B does not exist, then nothing happens. If field B does exist, then the result of the rename is that the data in field B will be removed. The data in field B will contain null values.

Note – Use quotation marks when you rename a field with a phrase.

Example-1:

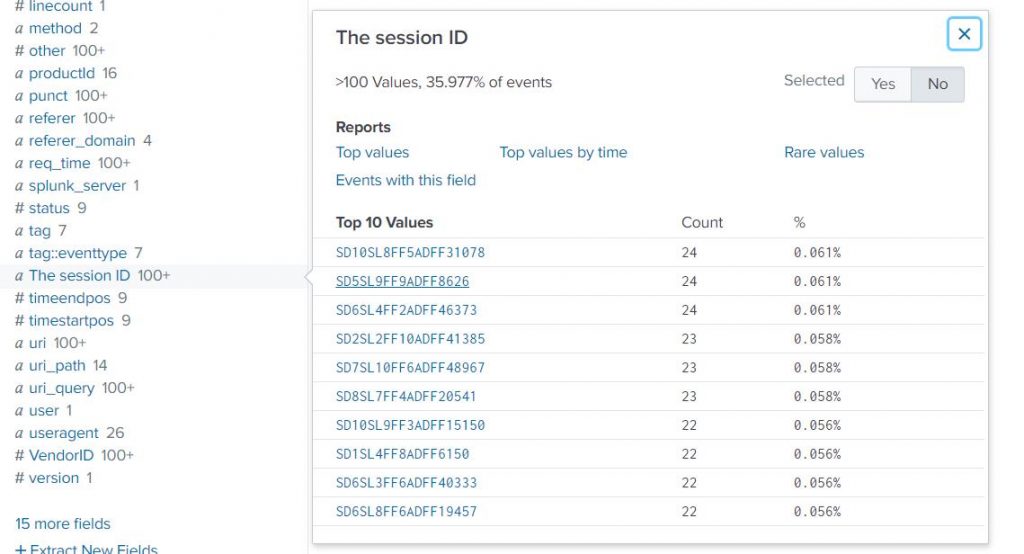
Rename field named JSESSIONID into a human-readable format. 

index=test | rename JSESSIONID AS “The session ID”

Example-2:

Rename the clientip field to “IP Address”.

index=test | rename clientip AS “IP Address”

Table and fields

The table command is a formatting command and returns a table that is formatted by only the fields that you specify in the arguments. Columns are displayed in the same order that fields are specified. Column headers are the field names. Rows are the field values. Each row represents an event.

The fields command is a filtering command.

The fields command can keep or remove fields from/to the results.

… | fields – A, B – Removes field A and B

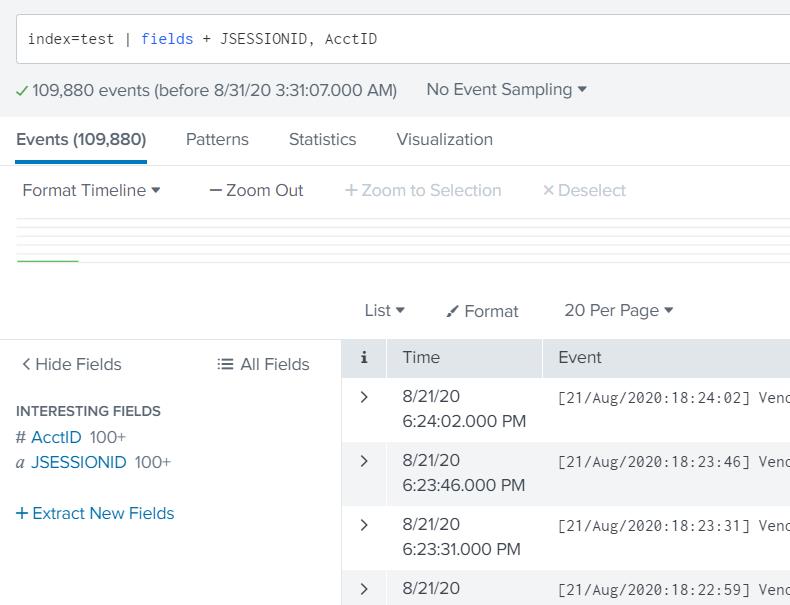
… | fields + A, B – Keeps field A and B and removes all other fields from the results

index=test | fields + JSESSIONID, AcctID

Sort

The sort command sorts all the results by the specified fields. Results missing a given field are treated as having the smallest or largest possible value of that field if the order is descending or ascending, respectively.

If the first argument to the sort command is a number, then at most that many results are returned in order. If no number is specified, then the default limit of 10000 is used. If the number 0 is specified, then all the results are returned. See the count argument for more information.

By default, the sort command automatically tries to determine what it is sorting. If the field takes on numeric values, the collating sequence is numeric. If the field takes on IP address values, the collating sequence is for IPs. Otherwise, the collating sequence is in lexicographical order. 

Some specific examples are:

  • Alphabetic strings and punctuation are sorted lexicographically in the UTF-8 encoding order.
  • Numeric data is sorted in either ascending or descending order.
  • Alphanumeric strings are sorted based on the data type of the first character. If the string starts with a number, then the string is sorted numerically based on that number alone. Otherwise, strings are sorted lexicographically.
  • Strings that are a combination of alphanumeric and punctuation characters are sorted the same way as alphanumeric strings.

Example-1:

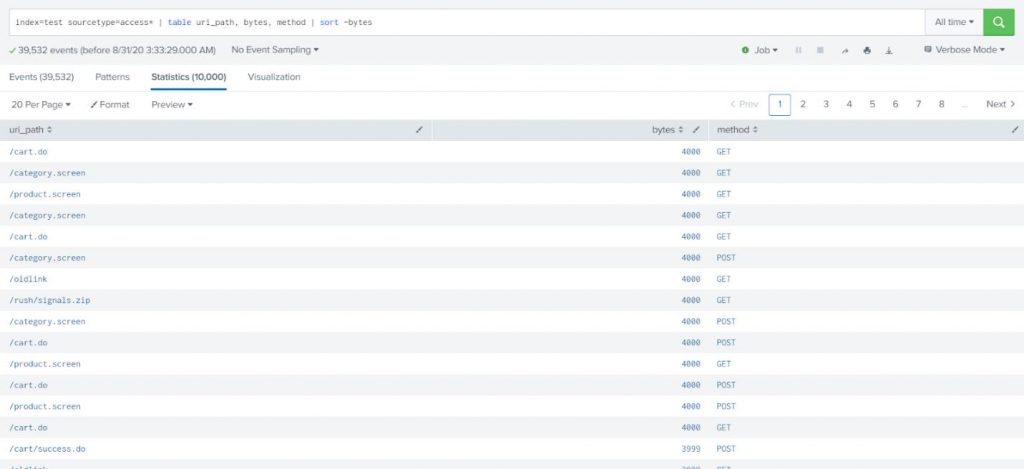
Sort results of web accesses by the request size (descending order).

index=test sourcetype=access* | table uri_path, bytes, method | sort -bytes

Example-2:

Sort web access data sort in ascending order of HTTP status code.

index=test sourcetype=access* | table uri_path, bytes, method, status | sort status

Reporting

These commands are used to build transforming searches andreturn statistical data tables that are required for charts and other kinds of data visualizations.

Reporting commands:

  • Stats
  • Timechart
  • Top

Advanced Commands:

  • Stats vs eventstats vs streamstats
  • Timechart vs chart

Stats

The stats command calculates aggregate statistics such as average, count, and sum, over the results set, similar to SQL aggregation. 

If the stats command is used without a BY clause only one row is returned, it is the aggregation over the entire incoming result set. If a BY clause is used, one row is returned for each distinct value specified in the BY clause.

Example-1:

Determine the average request size served in total for each host.

index=test sourcetype=access* | stats avg(bytes) BY host

Example-2:

You can also rename the new field to another field name with the stats command.

index=test sourcetype=access* | stats count(eval(status=”404″)) AS count_status BY sourcetype


Timechart

A timechart is a statistical aggregation applied to a field to produce a chart with time used as the X-axis. 

You can specify a split-by field where each distinct value of the split-by field becomes a series in the chart.

The timechart command accepts either the bins OR span argument. If you specify both bins and span, span will be used and the bins argument will be ignored.

If you do not specify either bins or span, the timechart command uses the default bins=100.

Example-1:

Display column chart over time to show number of requests per day (use web access data, sourcetype=access*).

index=test sourcetype=access* | timechart span=1d count

See Visualization and select “column chart”

Example-2:

Show the above data with different lines (in a chart) grouped by file. In other words, show the number of requests per file (see field name file) in the same chart.

index=test sourcetype=access* | timechart span=1d count by file

See visualization and select “line chart”.

Top

Top finds the most common values for the fields in the field list. It calculates a count and a percentage of the frequency the values occur in the events. 

If the is included, the results are grouped by the field you specify in the .

  • Count – The number of events in your search results that contain the field values that are returned by the top command. See the countfield and showcount arguments.
  • Percent – The percentage of events in your search results that contain the field values that are returned by the top command. See the percentfield and showperc arguments.

Example-1:

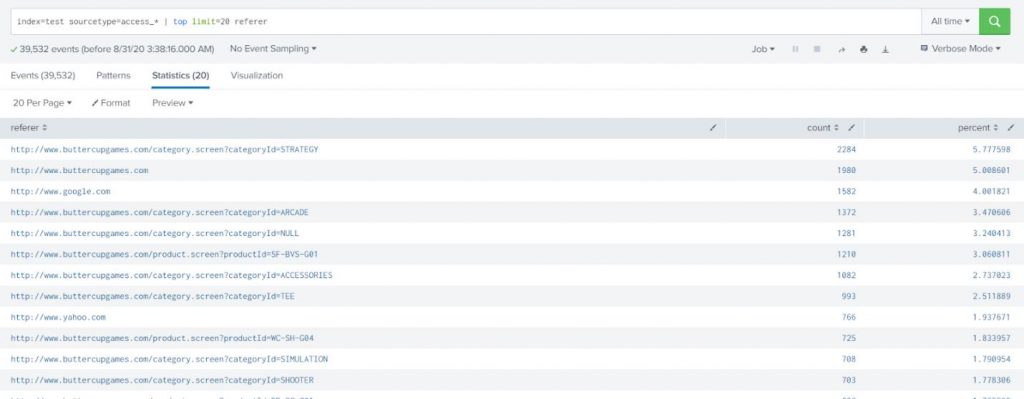
Write a search that returns the 20 most common values of the referer field. 

index=test sourcetype=access_* | top limit=20 referer

The results show the top 20 referer events by count and include the total percentage.
Streamstats

The streamstats command adds cumulative summary statistics to all search results in a streaming manner, calculating statistics for each event at the time the event is seen. For example, you can calculate the running total for a particular field. The total is calculated by using the values in the specified field for every event that has been processed up to the last event.

  • Indexing order matters with the output.
  • It holds memory of the previous event until it receives a new event.

Example:

Compute the total request size handled by the server over time (on day 1 the value should be the total of all the requests, on day 2 the size should be the sum of all the requests from both day 1 and day 2).

Use web access data (sourcetype=access*).

index=test sourcetype=access* | sort +_time| streamstats sum(bytes) as total_request_handled | eval total_GB=round(total_request_handled/(1024*1024),2) | timechart span=1d max(total_GB)

Eventstats

Eventstats generate summary statistics from fields in your events in the same way as the stats command but save the results as a new field instead of displaying them as a table.

  • Indexing order does not matter with the output.
  • It looks for all the events at a time then computes the result.

Stats vs eventstats

Stats

Eventstats

Events are transformed into a table of aggregated search results.

Aggregations are placed into a new field that is added to each of the events in your output.

You can only use the fields in your aggregated results in subsequent commands in the search.

You can use the fields in your events in subsequent commands in your search because the events have not been transformed.

Example:

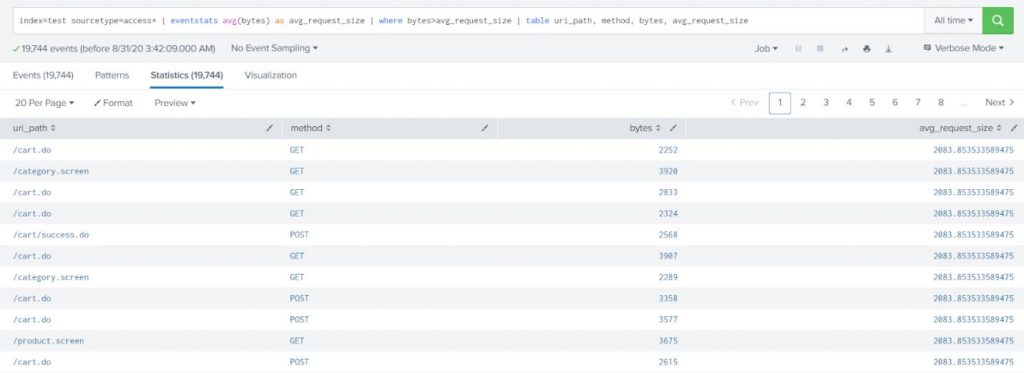
Show all the web access requests which have request size greater than the average size of all the requests.

index=test sourcetype=access* | eventstats avg(bytes) as avg_request_size | where bytes>avg_request_size | table uri_path, method, bytes, avg_request_size

Correlation commands

These commands are used to build correlation searches. You can combine results from multiple searches and find the correlation between various fields.

Event correlation allows you to find relationships between seemingly unrelated events in data from multiple sources and to help understand which events are most relevant.

Correlation commands:

  • Join
  • Append
  • Appendcol

Advanced Correlation commands:

  • Appendpipe
  • Map

Join

Use the join command to combine the results of a subsearch with the results of the main search. One or more fields must be in common for each result set.

By default, it performs the inner join. You can override the default value using the type option of the command.

To return matches for one-to-many, many-to-one or many-to-many relationships include the max argument in your join syntax and set the value to 0. By default max=1, which means that the subsearch returns only the first result from the subsearch. Setting the value to a higher number or to 0, which is unlimited, returns multiple results from the subsearch.

Example:

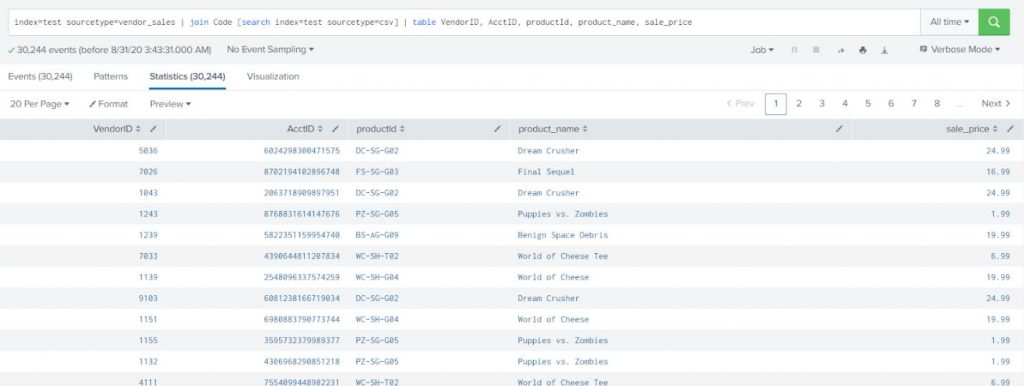
Show vendor information (sourcetype=vendor_sales) with complete product details (details about the product can be found from sourcetype=csv) including product name and price.

index=test sourcetype=vendor_sales | join Code [search index=test sourcetype=csv] | table VendorID, AcctID, productId, product_name, sale_price

Append

The append command adds the results of a subsearch to the current results. It runs only over historical data and does not produce the correct results if used in a real-time search.

Example-1:

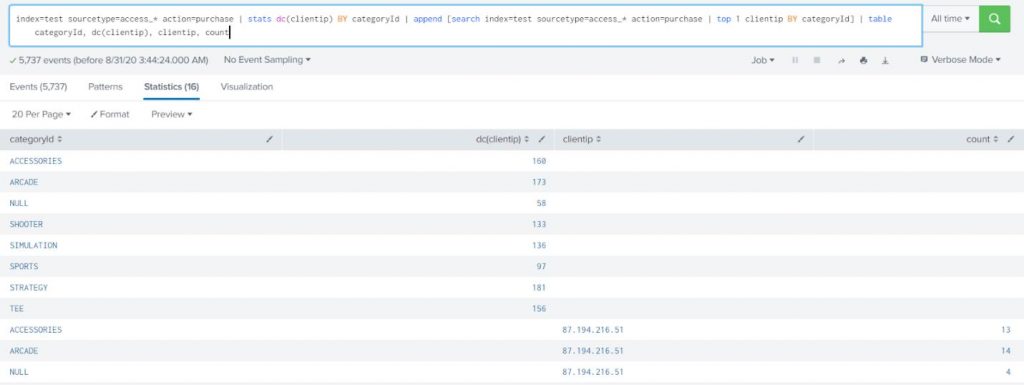
Count the number of different customers who purchased something from the Buttercup Games online store yesterday and display the count for each type of product (accessories, t-shirts, and type of games) they purchased. Also, list the top purchaser for each type of product and how much product that person purchased. Append the top purchaser for each type of product and use the data from the source prices.csv.zip.

index=test sourcetype=access_* action=purchase | stats dc(clientip) BY categoryId | append [search index=test sourcetype=access_* action=purchase | top 1 clientip BY categoryId] | table categoryId, dc(clientip), clientip, count

Explanation:

In this example, the first searches are for purchase events (action=purchase). These results are piped into the stats command and the dc(), or distinct_count() function is used to count the number of different users who make purchases. The BY clause is used to break up this number based on the different categories of products (category).


This example contains a subsearch as an argument for the append command.

 …[search sourcetype=access_* action=purchase | top 1 clientip BY categoryId]


The subsearch is used to search for purchase-related events and counts the top purchaser (based on clientip) for each product category. These results are added to the results of the previous search using the append command.


The table command is used to display only the category of products (categoryId), the distinct count of users who purchased each type of product (dc(clientip)), the actual user who purchased the most of a product type (clientip) and the number of each product that user purchased (count).


Example-2:

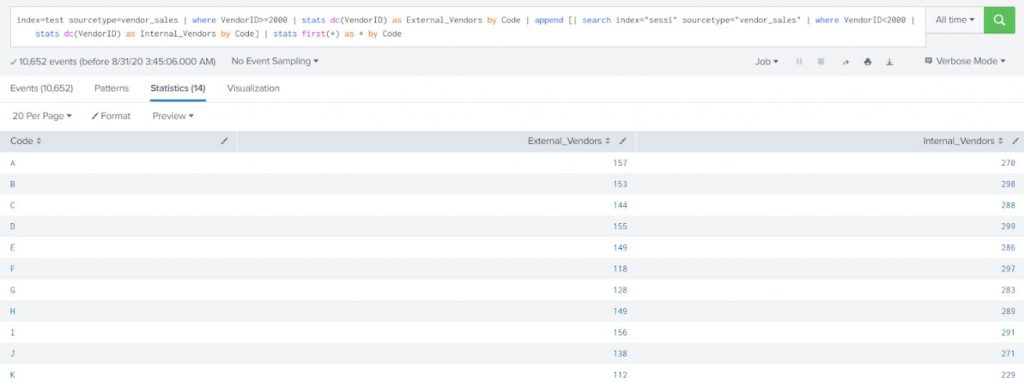
Show the count of distinct internal vendors (VendorID<2000) and count of distinct external vendors (VendorID>=2000) with all the Product Code.


The output should be formatted as listed below:

       Code      Internal Vendors      External Vendors

        A              5                              4

        B              1                              3


index=test sourcetype=vendor_sales | where VendorID>=2000 | stats dc(VendorID) as External_Vendors by Code | append [| search index=”sessi” sourcetype=”vendor_sales” | where VendorID<2000 | stats dc(VendorID) as Internal_Vendors by Code] | stats first(*) as * by Code


Appendpipe

The appendpipe command adds the result of the subpipeline to the search results. 

Unlike a subsearch, the subpipeline is not run first – it is run when the search reaches the appendpipe command.

The appendpipe command can be useful because it provides a summary, total, or otherwise descriptive row of the entire dataset when you are constructing a table or chart. This command is also useful when you need the original results for additional calculations.

Example:
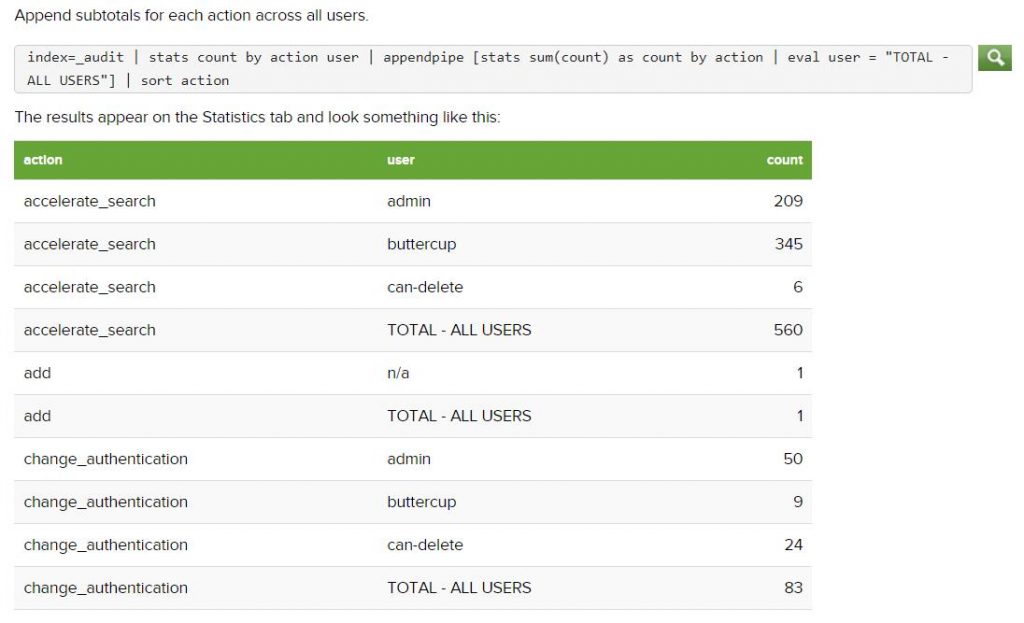
Reference Appendpipe command

Map

The map command is a looping operator that runs a search repeatedly for each input event or result. You can run the map command on a saved search or an ad hoc search but cannot use the map command after an append or appendpipe command in your search pipeline.

Example:

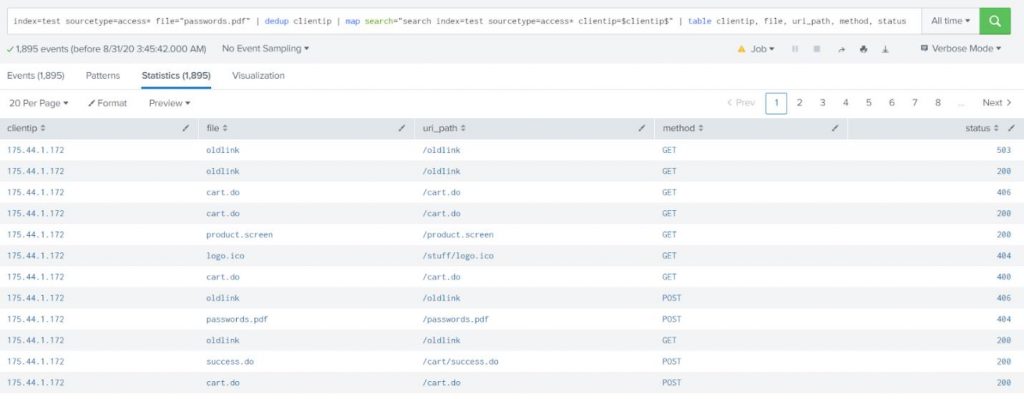
Show the web activity for all IP addresses which have tried accessing the file “passwords.pdf.”

index=test sourcetype=access* file=”passwords.pdf” | dedup clientip | map search=”search index=test sourcetype=access* clientip=$clientip$” | table clientip, file, uri_path, method, status

Explanation:

The $clientip$ is a token within the search of map command. It will be replaced with the value of clientip field from the result of the first search. So, the search for map command will be executed as many times as the number of results from the first search.
More useful commands

  • Predict
  • Addinfo (Not explained in the post, Reference)
  • Set
  • Iplocation
  • Geostats

Predict

The predict command forecasts values for one or more sets of time-series data. Additionally, the predict command can fill in missing data in a time-series and can also provide predictions for the next several time steps.

The predict command provides confidence intervals for all its estimates. The command adds a predicted value and an upper and lower 95th percentile range to each event in the time-series.

How the predict command works:

  • The predict command models the data by stipulating that there is an unobserved entity that progresses through time in different states.
  • To predict a value, the command calculates the best estimate of the state by considering all the data in the past. To compute estimates of the states, the command hypothesizes that the states follow specific linear equations with Gaussian noise components.
  • Under this hypothesis, the least-squares estimate of the states is calculated efficiently. This calculation is called the Kalman filter or Kalman-Bucy filter. A confidence interval is obtained for each state estimate. The estimate is not a point estimate but a range of values that contain either the observed or predicted values.

Example:

Predict future access based on the previous access numbers that are stored in Apache web access log files. Count the number of access attempts using a span of one day.

index=test sourcetype=access* | timechart span=1d count(file) as count | predict count

The results appear on the Statistics tab. Click the Visualization tab. If necessary, change the chart type to a Line Chart.

As of machine learning concepts, the more the data the better the prediction. So, if you have data for a longer period of time, then you will have a better prediction. 

Set

The set command performs set operations on subsearches.

  • Union – Returns a set that combines the results generated by the two subsearches. Provides results that are common to both subsets only once.
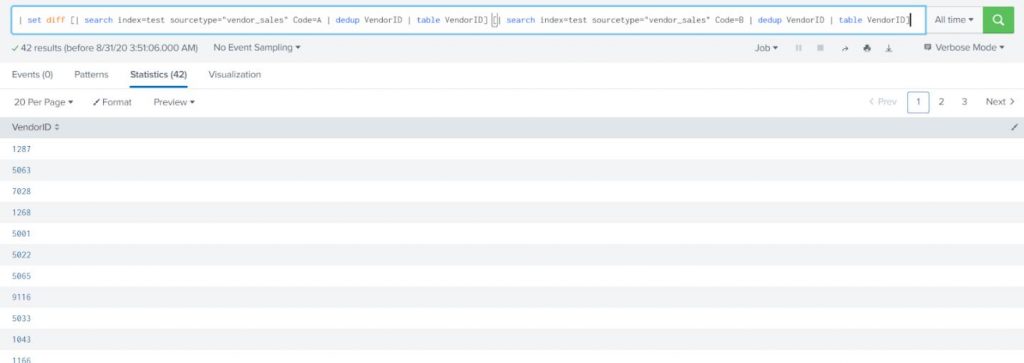
  • Diff – Returns a set that combines the results generated by the two subsearches and excludes the events common to both. Does not indicate which subsearch the results originated from.
  • Intersect – Returns a set that contains results common to both subsearches.

Example:

Find all the distinct vendors who purchase item A (Code=A) but not item B.

| set diff [| search index=test sourcetype=”vendor_sales” Code=A | dedup VendorID | table VendorID] [| search index=test sourcetype=”vendor_sales” Code=B | dedup VendorID | table VendorID]

Iplocation

Iplocation extracts location information from IP addresses by using 3rd-party databases. This command supports IPv4 and IPv6.

The IP address that you specify in the ip-address-fieldname argument is looked up in the database. Fields from that database that contain location information are added to each event. The setting used for the allfields argument determines which fields are added to the events.

Since all the information might not be available for each IP address, an event can have empty field values.

For IP addresses that do not have a location, such as internal addresses, no fields are added.

Example-1:

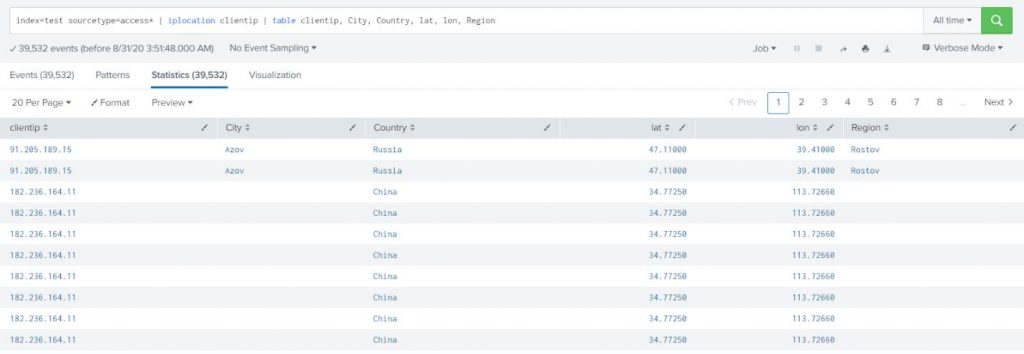
Add location information to web access events. By default, the iplocation command adds the City, Country, lat, lon, and Region fields to the results.

index=test sourcetype=access* | iplocation clientip | table clientip, City, Country, lat, lon, Region

Example-2:

Search for client errors in web access events, returning only the first 20 results. Add location information and return a table with the IP address, City, and Country for each client error.

index=test sourcetype=access* status>=400 | head 20 | iplocation clientip | table clientip, status, City, Country


We usually use the iplocation command to get the geolocation and the best way to visualize the geolocation is Map. In that case the geostats command can be used.

Geostats

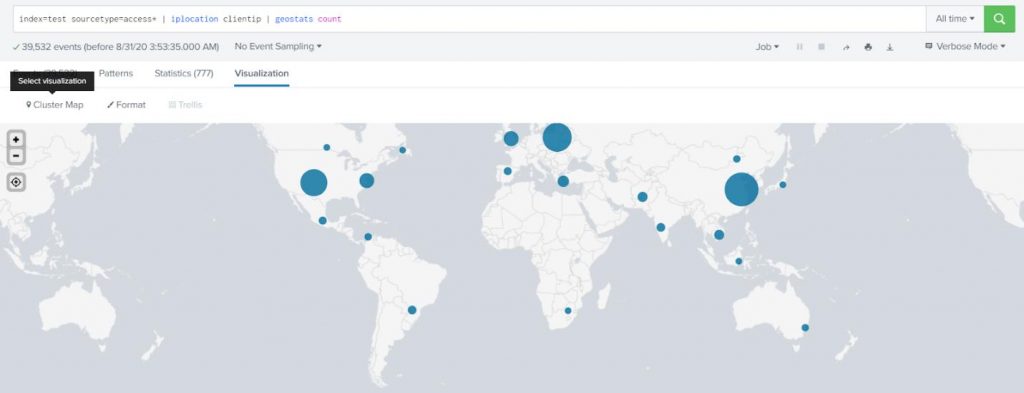
The fun part is that once you get the geo-location with the iplocation command, you can put the results on a map for a perfect visualization.


The geostats command works in the same fashion as the stats command.


Example:

Show the number of requests coming in by different geographical locations on the map (use sourcetype=access*).


index=test sourcetype=access* | iplocation clientip | geostats count

Choose a Cluster Map for visualization.


Written by Usama Houlila.

Any questions, comments, or feedback are appreciated! Leave a comment or send me an email to uhoulila@newtheme.jlizardo.com for any questions you might have. Happy Splunking 🙂

The ABC’s of Splunk Part Four: Deployment Server

Aug 3, 2020 by Sam Taylor

Thank you for joining us for part four of our ABC’s of Splunk series. If you haven’t read our first three blogs, get caught up here! Part 1Part 2Part 3.

When I started working with Splunk, our installations were mostly small with less than 10 servers and the rest of the devices mainly involved switches, routers, and firewalls. In the current environments which we manage most installations have more than three hundred servers which are impossible to manage without some form of automation. As you manage your environment over time, one of the following scenarios will make you appreciate the deployment server:

  1. You need to update a TA (technology add-on) on some, if not all, of your Universal Forwarders.
  2. Your logging needs changed over time and now you need to collect more or less data from your Universal Forwarders.
  3. You’re in the middle of investigating a breach, and/or an attack, and need to quickly push a monitoring change to your entire environment. – How cool is that!

What is a Deployment Server?

A deployment server is an easy way to manage forwarders without logging into them directly and individually to make any changes. Forwarders are the Linux or Microsoft Windows servers that you are collecting logs from by installing the Splunk Universal Forwarder.

Deployment servers also provide a way to show you which server has which Apps and whether those servers are in a connected state or offline.

Please note that whether you use Splunk Cloud or on-prem, the Universal Forwarders are still your responsibility and I hope that this blog will provide you with some good insights.

Deployment Server Architecture:

The below image shows how a deployment architecture looks conceptually.

There are three core components of the deployment server architecture:

  1. Deployment Apps
    Splunk Apps that will be deployed to the forwarders.
  2. Deployment Client
    The forwarder instances on which Splunk Apps will be deployed.
  3. Server Classes
    A logical way to map between Apps and Deployment Clients.
    • You can have multiple Apps within a Server Class.
    • You can deploy multiple Server Classes on a single Deployment Client.
    • You can have the same Server Class deployed on multiple Clients.

How Deployment Server Works:

  1. Each deployment client periodically polls the deployment server, identifying itself.
  2. The deployment server determines the set of deployment Apps for the client based on which server classes the client belongs to.
  3. The deployment server gives the client the list of Apps that belong to it, along with the current checksums of the Apps.
  4. The client compares the App info from the deployment server with its own App info to determine whether there are any new or updated Apps that it needs to download.
  5. If there are new or updated Apps, the Deployment Client downloads them.
  6. Depending on the configuration for a given App, the client might restart itself before the App changes take effect.

Where to Configure the Deployment Server:

The recommendation is to use a dedicated machine for the Deployment Server. However, you can use the same machine for other management components like “License Master”, “SH Cluster Deployer” or “DMC”. Do not combine it with Cluster Master.

Configuration:

I started writing this in a loose format explaining the concepts but quickly realized that a step by step is a much easier method to digest the process

1. Create a Deployment Server

By default, a Splunk server install does not have the deployment server configured and if you were to go to the GUI and click on settings, forwarder management, you will get the following message.

To enable a deployment server, you start by installing any App in $SPLUNK_HOME/etc/deployment-apps directory. If you’re not sure how to do that, download any App that you want through the GUI on the server you want to configure  (see the example below)

and then using the Linux shell or Windows server Cut/Paste, mv the entire App directory that was created from $SPLUNK_HOME/etc/apps where it installs by default to $SPLUNK_HOME/etc/deployment-apps. See below:

Move 

/opt/splunk/etc/apps/Splunk_TA_windows$

To /opt/splunk/etc/deployment-apps/Splunk_TA_windows$

This will automatically allow your Splunk server to present you with the forwarder management interface

2. Manage Server Classes Apps and Clients

Next, you will need to add a server class. Go to Splunk UI > Forwarder Management > Server Class. Create a new server class from here.

Give it a name that is meaningful to you and your staff and go to Step 3

3. Point the Clients to this Deployment Server

You can either specify that in the GUI guided config when you install Splunk Universal Forwarder on a machine or by using the CLI post installation

Splunk set deploy-poll <IP_address/hostname>:

Where,

IP_Address – IP Address of Deployment Server

management_port – Management port of deployment server (default is 8089)

4. Whitelist the Clients on the Deployment Server

Go to any of the server classes you just created, click on edit clients.

For Client selection, you can choose the “Whitelist” and “Blacklist” parameters. You can write a comma-separated IP address list in the “Whitelist” box to select those Clients

5. Assign Apps to Server Classes:

Go to any of the server classes you just created, and click on edit Apps.

Click on the Apps you want to assign to the server class.

Once you add Apps and Clients to a Server Class, Splunk will start deploying the Apps to the listed Clients under that Server Class.

You will also see whether the server is connected and the last time it phoned home.

Note – Some Apps that you push require the Universal Forwarder to be restarted. If you want Splunk Forwarder to restart on update of any App, edit that App (using the GUI) and then select the checkbox “Restart on Deploy”.

Example:

You have a few AD servers, a few DNS servers and a few Linux servers with Universal Forwarders installed to get some fixed sets of data, and you have 4 separate Apps to collect Windows Performance data, DNS specific logs, Linux audit logs, and syslogs.

Now you want to collect Windows Performance logs from all the Windows servers which includes AD servers, and DNS servers. You would also like to collect syslog and audit logs from Linux servers.

Here is what your deployment server would look like:

  • Server Class – Windows
    • Apps – Windows_Performance
    • Deployment Client – All AD servers and All DNS servers
  • Server Class – DNS
    • Apps – DNS_Logs
    • Deployment Client – DNS servers
  • Server Class – Linux
    • Apps – linux_auditd, linux_syslog
    • Deployment Client – Linux servers
6. How to Verify Whether Forwarder is Sending Data or Not?

Go to the Search Head and search with the below search (Make sure you have rights to see internal indexes data):

index=_internal | dedup host | fields host | table host

Look in the list to see if your Forwarder’s hostname is in the list, if it is present that means the Forwarder is connected. If you are missing a host using the above command, you might have one of two problems:

  1. A networking and or firewall issue somewhere in between and or on the host.
  2. Need to redo step 3 and/or restart the Splunk process on that server.

If you are missing a particular index/source data then check inputs.conf configuration in the App that you pushed to that host.

Other Useful Content:

Protect content during App updates (A must-read to minimize the amount of work you have to do overtime managing your environment)

https://docs.splunk.com/Documentation/Splunk/8.0.5/Updating/Excludecontent

Example on the Documentation

https://docs.splunk.com/Documentation/Splunk/8.0.5/Updating/Extendedexampledeployseveralstandardforwarders

Written by Usama Houlila.

Any questions, comments, or feedback are appreciated! Leave a comment or send me an email to uhoulila@newtheme.jlizardo.com for any questions you might have.

Beware “Phishy” Emails

Jun 18, 2020 by Sam Taylor

By Wassef Masri

When the accounting manager at a major retail US company received an email from HR regarding harassment training, he trustingly clicked on the link. Had he looked closer, he could’ve caught that the source was only a look-alike address. Consequently, he was spear-phished.

The hackers emailed all company clients and informed them of a banking account change. The emails were then deleted from the “sent” folder. By the time the scam was discovered a month later, $5.1 Million were stolen.

As in the previous crisis of 2008, cyber-crime is on the rise. This time however, hackers are higher in numbers and more refined in techniques. Notably, the emergence of malware-as-a-service offerings on the dark web is giving rise to a class of non-technical hackers who are better at marketing and social engineering skills.

Phishing emails are the most common attack vector and are often the first stage of a multi-stage attack. Most organizations today experience at least one attack a month.

What started as “simple” phishing that fakes banking emails has evolved into three types of attacks that increase in sophistication:

  • Mass phishing: Starts with a general address (e.g. “Dear customer”) and impersonates a known brand to steal personal information such as credit card credentials.
  • Spear phishing: More customized than mass phishing and addresses the target by his/her name, also through spoofed emails and sites.

  • Business Email Compromise (BEC): Aka CEO fraud, is more advanced because it is sent from compromised email accounts, making them harder to uncover. They mostly target company funds.

How to Protect Against Phishing?

While there is no magical solution, best practices are multi-level combining advanced technologies with user education:

1. User awareness: Frequent testing campaigns and training.

2. Configuration of email system to highlight emails that originate from outside of the organization

3. Secure email gateway that blocks malicious emails or URL’s. It includes:

  • Anti-spam
  • IP reputation filtering
  • Sender authentication
  • Sandboxing
  • Malicious URL blocking

4. Endpoint security: The last line of defense; if the user does click a malicious link or attachment, a good endpoint solution has:

  • Deep learning: blocks new unknown threats
  • Anti-exploit: stops attackers from exploiting software vulnerabilities
  • Anti-ransomware: stops unauthorized encryption of company resources

It is not easy to justify extra spending especially with the decrease in IT budgets projected for 2020. It is essential however to have a clear strategy to prioritize action and to involve organization leadership in mitigating the pending threats.

Leave a comment or send an email to wmasri@newtheme.jlizardo.com for any questions you might have!

Tips and Tricks with MS SQL (Part 10)

Mar 26, 2020 by Sam Taylor

Cost Threshold for Parallelism? A Simple Change to Boost Performance

Many default configuration values built-in to Microsoft SQL Server are just long-standing values expected to be changed by a DBA to fit their current environment’s needs. One of these configs often left unchanged is “Cost Threshold for Parallelism” (CTFP). In short, this determines, based on determined query cost (i.e.. estimated workload of a query plan) it’s availability to execute in parallel with multiple CPU threads. A higher CTFP value limits queries to run parallel unless it’s cost exceed the set value.  

Certain queries may be best suited to run on single-core performance, while others would benefit more from parallel multi-core execution. The determination of this is based on many variables, including the physical hardware, type of queries, type of data, and many other things. The good news is that SQL’s Query Optimizer helps makes these decisions by using those queries’ “cost” based on the query plan they execute. Cost is assigned by the cardinality estimator.. more on that later.

Here’s our opportunity to optimize the default CTFP value of 5. The SQL Server algorithm (cardinality estimator) that determines query plan cost changed significantly from SQL Server 2012 to present day SQL Server 2016+. Increasing this value to a higher number will allow the query to run via single-core performance which is generally faster than multi-core performance (referencing the top commercial grade CPUs). The common consensus on almost every SQL tuning website, including Microsoft’s own docs, suggests this value should be increased; common agreement as the value of 20 to 30 being a good starting point. Compare your current query plan execution times, increase CTFP, compare new times, and repeat until the results are most favorable.

Since my future blog posts in this series will become more technical, right now’s a perfect time to get your feet wet. Here’s two different methods you can use to make these changes.

Method 1: T-SQL

Copy/Paste the following T-SQL into a new query Window:

            USE [DatabaseName] ; — This database where this will be changed.

            GO

            EXEC sp_configure ‘show advanced options’ , 1 ; — This enables CTFP to be changed

            GO

            RECONFIGURE

            GO

            EXEC sp_configure ‘cost threshold for parallelism’, 20 ; — The CTFP value will be 20 here

            GO

            RECONFIGURE

            GO

Method 2: GUI

To make changes via SQL Server Management Studio:

            1. In Object Explorer – Right Click Instance – Properties – Advanced – Under “Parallelism” change value for “Cost Threshold for Parallelism” to 20

            2. For changes to take effect, open a query window a run “RECONFIGURE” and execute query.

If you’d like to learn how to see query plan execution times, which queries to compare, and how to see query costs, leave a comment or message me. Keep a look out for my next post which will include queries to help you identify everything I’ve covered in this blog series so far. Any questions, comments, or feedback are appreciated! Leave a comment or send me an email to aturika@newtheme.jlizardo.com for any SQL Server questions you might have!

Tips and Tricks With MS SQL (Part 9)

Mar 18, 2020 by Sam Taylor

Backups Need Backups

This week I’ve decided to cover something more in the style of a PSA than dealing with configurations and technical quirks that help speed up Microsoft SQL servers. The reason for the change of pace is from what I’ve been observing lately. It’s not pretty.

Backups end up being neglected. I’m not just pointing fingers at the primary backups, but where are the backup’s backups? The issue here is – what happens when the primary backups accidentally get deleted, become corrupt, or the entire disk ends up FUBAR? This happens more often than people realize. A disaster recovery plan that doesn’t have primary backups replicated to an offsite network or the very least in an isolated location is a ticking time bomb.

A healthy practice for the primary backups is to verify the integrity of backups after they complete. You can have Microsoft SQL Server perform checksum validation before writing the backups to media. This way if the checksum value for any page doesn’t exactly match that which is written to the backup, you’ll know the backup is trash. This can be done via scripts, jobs, or via manual backups. Look for the “Media” tab when running a backup task in SQL Server Management Studio. The two boxes to enable are “Verify backup when finished” and “Perform checksum before writing to media”.

It’s true we’re adding extra overhead here and might take backups a bit longer to finish. But I’ll leave it up to you to decide if the extra time is worth having a working backup you can trust to restore your database or a broken backup wasting precious resources. For the sake of reliability, if you decide time is more important, then at least have a script perform these reliability checks on a regular basis or schedule regular restores to make sure they even work.

If you follow this advice you can rest easy knowing your data can survive multiple points of failure before anything is lost. If the server room goes up in flames, you can always restore from the backups offsite. If you need help finding a way to have backup redundancy, a script to test backup integrity, or questions about anything I covered feel free to reach out. Any questions, comments, or feedback are always appreciated! Leave a comment or send me an email to aturika@newtheme.jlizardo.com for any SQL Server questions you might have!

Helpful Tips for Remote Users in the Event of a Coronavirus Outbreak

Mar 3, 2020 by Sam Taylor

Remember: Planning ahead is critical.

In response to recent news, we have a few reminders to assist with your remote access preparedness to minimize the disruption to your business. 

Remote Access

Make sure your users have access to and are authorized to use the necessary remote access tools, VPN and/or Citrix.  If you do not have a remote access account, please request one from your management and they can forward their approval to IT.

Email

If you are working from home and are working with large attachments, they can also be shared using a company approved file sharing system such as Office 365’s OneDrive, Dropbox or Citrix Sharefile. Make sure you are approved to use such service and have the relevant user IDs and passwords.  Its best to test them out before you need to use them. Make sure to comply with any security policies in effect for using these services.

Office Phone

Ensure continued access to your 3CX office phone by doing either of these things:

  1. Installing the 3CX phone software on your laptop, tablet or smartphone
  2. Forward your calls to your cell or home phone. Remember you can also access your work voice mail remotely. 

Virtual Meetings

Web meetings or video conferences become critical business tools when working remotely.  Make sure you have an account with your company web meeting/video service, with username and password.  It is a good idea to test it now to ensure your access is working correctly.

Other Recommendations

Prepare now and notice the information and supplies you need on a daily basis.  Then bring the critical information and supplies home with you in advance so you have them available in the event you need to work remotely.  Such items may include:

  1. Company contact information including emergency contact info (including Phone numbers)

  2. Home office supplies such as printer paper, toner and flash drives.

  3. Mailer envelopes large enough to send documents, etc.

  4. Make note of the closest express mailing location near your home and company account information if available

CrossRealms can help set up and manage any or all of the above for you so you can focus on your business and customers.

If you are a current CrossRealms client, please feel free to contact our hotline at 312-278-4445 and choose No.2, or email us at techsupport@newtheme.jlizardo.com

We are here to help!

Yealink Releases New T5 Business Phone Series

Feb 24, 2020 by Sam Taylor

The Yealink T5 Business Phone Series – Redefining Next-Gen Personal Collaboration Experience

Yealink, the global leading provider of enterprise communication and collaboration solutions, recently announced the release of the new T5 Business Phone Series and VP59 Flagship Smart Video Phone. Being responsive to changes and demands in the marketplace, Yealink has designed and developed its novel T5 Series, the most advanced IP desktop phone portfolio in the industry. With the leading technology, the multifunctional T5 Business Phone Series provides the best personalized collaboration experience and great flexibility to accommodate the needs of the market.

In T5 Business Phone Series, seven phone models are introduced to cover different demands. Ergonomic design with larger LCD displays, the Yealink T5 Business Phone Series is specially developed for users to optimize visual experience, by utilizing the fully adjustable HD screen based on varied lightings, heights and sitting positions. This flexible function enables users to always maintain the best angle of view.

With the strong support of exclusive Yealink Acoustic Shield technology, a virtual voice “shield” is embedded in each model of T5 Business Phone Series.  Yealink Acoustic Shield technology uses multiple microphones to create the virtual “shield” between the speaker and the outside sound source. Once enabled, it intelligently blocks or mutes sounds from outside the “shield” so that the person on the other end hears you only and follows you clearly. This technology dramatically reduces frustration and improves productivity.

Featuring the advanced built-in Bluetooth and Wi-Fi, the high technology in the Yealink T5 Business Phone Series creates the industry-leading connectivity and scalability for its users to explore.  T5 Series effortlessly supports wireless communication and connection through wireless headsets and mobile phones in synch. Additionally, it is ready for seamless switching of call between desktop phone and cordless DECT headset via a corded-cordless phone configuration. 

The Yealink T5 Business Phone Series is redefining Next-Gen personal collaboration experience. The value of a desktop phone is redefined.  More possibilities to discover, to explore and to redefine.

About Yealink

Founded in 2001, Yealink (Stock Code: 300628) is a leading global provider of enterprise communication and collaboration solutions, offering video conferencing service to worldwide enterprises. Focusing on research and development, Yealink also insists on innovation and creation. With the outstanding technical patents of cloud computing, audio, video and image processing technology, Yealink has built up a panoramic collaboration solution of audio and video conferencing by merging its cloud services with a series of endpoints products. As one of the best providers in more than 140 countries and regions including the US, the UK and Australia, Yealink ranks No.1 in the global market share of SIP phone shipments (Global IP Desktop Phone Growth Excellence Leadership Award Report, Frost & Sullivan, 2018).

For more information, please visit: www.yealink.com.

Splunk 2020 Predictions

Jan 7, 2020 by Sam Taylor

Around the turn of each new year, we start to see predictions issued from media experts, analysts and key players in various industries. I love this stuff, particularly predictions around technology, which is driving so much change in our work and personal lives. I know there’s sometimes a temptation to see these predictions as Christmas catalogs of the new toys that will be coming, but I think a better way to view them, especially as a leader in a tech company, is as guides for professional development. Not a catalog, but a curriculum.

We’re undergoing constant transformation — at Splunk, we’re generally tackling several transformations at a time — but too often, organizations view transformation as something external: upgrading infrastructure or shifting to the cloud, installing a new ERP or CRM tool. Sprinkling in some magic AI dust. Or, like a new set of clothes: We’re all dressed up, but still the same people underneath. 

I think that misses a key point of transformation; regardless of what tools or technology is involved, a “transformation” doesn’t just change your toolset. It changes the how, and sometimes the why, of your business. It transforms how you operate. It transforms you.

Splunk’s Look at the Year(s) Ahead

That’s what came to mind as I was reading Splunk’s new 2020 Predictions report. This year’s edition balances exciting opportunities with uncomfortable warnings, both of which are necessary for any look into the future.

Filed under “Can’t wait for that”: 

  • 5G is probably the most exciting change, and one that will affect many organizations soonest. As the 5G rollouts begin (expect it to be slow and patchy at first), we’ll start to see new devices, new efficiencies and entirely new business models emerge. 
  • Augmented and virtual reality have largely been the domain of the gaming world. However, meaningful and transformative business applications are beginning to take off in medical and industrial settings, as well as in retail. The possibilities for better, more accessible medical care, safer and more reliable industrial operations and currently unimagined retail experiences are spine-tingling. As exciting as the gaming implications are, I think that we’ll see much more impact from the use of AR/VR in business.
  • Natural language processing is making it easier to apply artificial intelligence to everything from financial risk to the talent recruitment process. As with most technologies, the trick here is in carefully considered application of these advances. 

On the “Must watch out for that” side:

  • Deepfakes are a disturbing development that threaten new levels of fake news, and also challenge CISOs in the fight against social engineering attacks. It’s one thing to be alert to suspicious emails. But when you’re confident that you recognize the voice on the phone or the image in a video, it adds a whole new layer of complexity and misdirection.
  • Infrastructure attacks: Coming into an election year, there’s an awareness of the dangers of hacking and manipulation, but the vulnerability of critical infrastructure is another issue, one that ransomware attacks only begin to illustrate.

Tools exist to mitigate these threats, from the data-driven technologies that spot digital manipulations or trace the bot armies behind coordinated disinformation attacks to threat intelligence tools like the MITRE ATT&CK framework, which is being adopted by SOCs and security vendors alike. It’s a great example of the power of data and sharing information to improve security for all.

Change With the Times

As a leader trying to drive Splunk forward, I have to look at what’s coming and think, “How will this transform my team? How will we have to change to be successful?” I encourage everyone to think about how the coming technologies will change our lives — and to optimize for likely futures. Business leaders will need greater data literacy and an ability to talk to, and lead, technical team members. IT leaders will continue to need business and communication skills as they procure and manage more technology than they build themselves. We need to learn to manage complex tech tools, rather than be mystified by them, because the human interface will remain crucial. 

There are still some leaders who prefer to “trust their gut” rather than be “data-driven.” I always think that this is a false dichotomy. To ignore the evidence of data is foolish, but data generally only informs decisions — it doesn’t usually make them. An algorithm can mine inhuman amounts of data and find patterns. Software can extract that insight and render an elegant, comprehensible visual. The ability to ask the right questions upfront, and decide how to act once the insights surface, will remain human talents. It’s the combination of instinct and data together that will continue to drive the best decisions.

This year’s Splunk Predictions offer several great ways to assess how the future is changing and to inspire thought on how we can change our organizations and ourselves to thrive.

Tips and Tricks with MS SQL (Part 8)

Dec 23, 2019 by Sam Taylor

Tame Your Log Files!

By default, the recovery model for database backups on Microsoft‘s SQL Server is set to “full”. This could cause issues for the uninitiated. If backups aren’t fully understood and managed correctly it could cause log files to bloat in size and get out of control. With the “full” recovery model, you get the advantage of flexibility in point-in-time restores and high-availability scenarios, but this also means having to run separate backups for log files in addition to the data files.


To keep things simple, we’ll look at the “simple” recovery model. When you run backups, you’re only dealing with data backups whether it’s a full or differential backup. The log file, which holds transactions between full backups, won’t be something you need to concern yourself with unless you’re doing advanced disaster recovery, like database mirroring, log shipping, or high-availability setups.


When dealing with a “full” recovery model, you’re not only in charge of backing up the data files, but the log files as well. In a healthy server configuration, log files are much smaller than data files. This means you can run log backups every 15 minutes or every hour without much IO activity as a full or differential backup. This is where you get the point-in-time flexibility. This is also where I often see a lot of issues…


Log files run astray. A new database might be created or migrated, and the default recovery model is still in “full” recovery mode. A server that relies on a simpler setup might not catch this nor have log backups in place. This means the log file will start growing exponentially, towering over the data file size, and creating hordes of VLFs (look out for a future post about these). I’ve seen a lot of administrators not know how to control this and resort to shrinking databases or files – which is just something you should never do unless your intentions are data corruption and breaking things.


My advice here is keep it simple. If you understand how to restore a full backup, differential backups, and log backups including which order they should be restored in and when to use “norecovery” flags,  or have third-party software doing this for you, you’re all set. If you don’t, I would suggest setting up log backups to run at regular and short interval (15 mins – 1 hour) as a precaution and changing the database recovery models to “simple”. This can keep you protected when accidentally pulling in a database that defaulted to the “full” recovery model and having its log file eat the entire disk.


Pro Tip: Changing your “model” database’s recovery model will determine the default recovery model used for all new databases you create.


Any questions, comments, or feedback are appreciated! Leave a comment or send me an email to aturika@newtheme.jlizardo.com for any SQL Server questions you might have!

Tips and Tricks with MS SQL (Part 7)

Dec 6, 2019 by Sam Taylor

Quickly See if Ad Hoc Optimization Benefits Your Workloads​

A single setting frequently left disabled can make a huge performance impact and free up resources. The setting is a system-wide setting that allows Microsoft SQL Server to optimize it’s processes for “Ad Hoc” workloads. Most SQL Servers I come across that rely heavily upon ETL (Extract – Transform – Load) workloads for their day-to-day would benefit from enabling “Optmize for AdHod Workloads” but often don’t have the setting enabled.

If you perform a lot of ETL workloads and want to know if enabling this option will benefit you, I’ll make it simple. First we need to determine the percentage of your cache plan that runs Ad Hoc. To do so just run the following T-SQL script in SQL Server Management Studio:

SELECT AdHoc_Plan_MB, Total_Cache_MB,

        AdHoc_Plan_MB*100.0 / Total_Cache_MB AS ‘AdHoc %’

FROM (

SELECT SUM(CASE

            WHEN objtype = ‘adhoc’

            THEN size_in_bytes

            ELSE 0 END) / 1048576.0 AdHoc_Plan_MB,

        SUM(size_in_bytes) / 1048576.0 Total_Cache_MB

FROM sys.dm_exec_cached_plans) T

After running this, you’ll see a column labelled “AdHoc %” with a value. As a general rule of thumb, I prefer to enable optmizing for Ad Hoc workloads when these values are between 20-30%. These numbers will change depending on the last time the server was reset so it’s best to check after the server has been running for at least a week or so. Changes only go into affect for new cached plans created. For the impatient, a quicker way to see the results of the change require restarting SQL Services to clear the plan cache.

Under extremely rare circumstanes this could actually hinder performance. If that’s the case just disable Ad Hoc and continue on as you were before. As always, feel free to ask me directly so I can help. There isn’t any harm in testing if this benefits your environment or not. To enable optmiziation, right click the SQL Instance from SQL Server Management Studio’s Object Explorer à Properties à Advanced à Change “Optmize for Ad Hoc Workloads” to “True” à Click “Apply”. From there run the query “RECONFIGURE” to put the change into action.

Any questions, comments, or feedback are appreciated! Leave a comment or send me an email to aturika@newtheme.jlizardo.com for any SQL Server questions you might have!