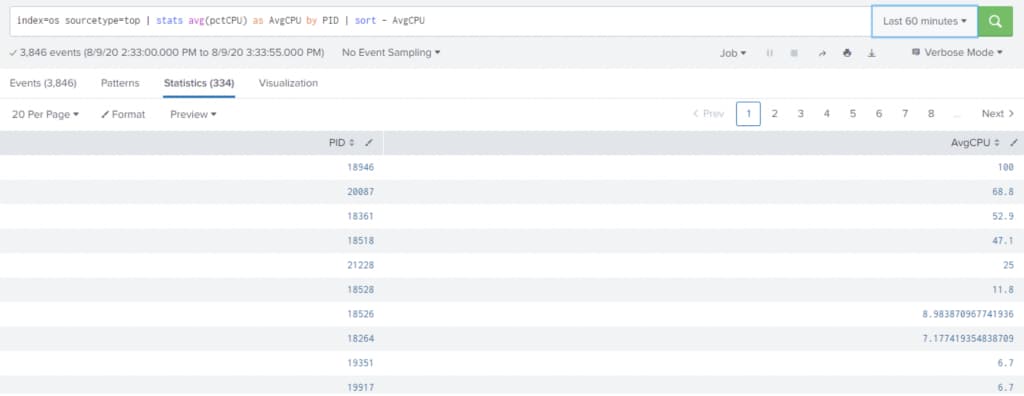
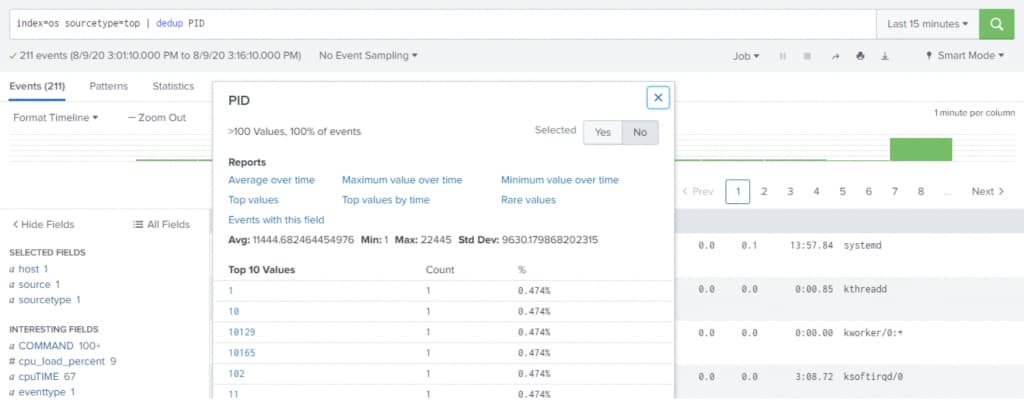
Security Incident handling with Splunk – Our new Cyences App published on Splunkbase
Security Incident handling with Splunk – Our new Cyences App published on Splunkbase

Dec 1, 2020 by Sam Taylor

Security Incident handling with Splunk – Our new Cyences App published on Splunkbase

For the past year, customers have asked us to simplify Splunk so that they are able to identify nefarious activities quickly. In addition, they wanted to be able to forensically investigate any event without having to be experts in Splunk Processing Language (SPL).

During our initial meetings, we started to realize that the issue is not as simple as creating alerts and dashboards, but more of building a security engineer’s application for Splunk. Most security engineers understand what bad traffic and orchestration looks like, but they can’t navigate Splunk to get to the bottom of things, so we started developing the Cyences App which this blog previews. 

Overview:

The Cyences App was developed to achieve the following initial objectives with more to come on monthly basis.

  1. Community-based development starting with our existing clients and branching out to others soon afterwards
  2. Unified panes of glass that within one or two screens can provide a wholistic viewpoint of what’s important to be observed (if a certain correlation report doesn’t have an alert associated with it, it’s not necessary to be in the nefarious activity pane)
  3. Activity monitoring should include workstations and users (pre-COVID, this was not necessary, but offices and office firewalls currently play a small part in securing user activity)
  4. Global view: Collecting and correlating logs throughout a single organization is no longer sufficient because the activity becomes more of a reactive response vs. proactive. We decided that Cyences will collect Global Activity that is deemed nefarious and correlate all incoming and outgoing packets to decide with more accuracy whether something is wrong
  5. Drill down forensics: We found many existing dashboards and apps to be lacking because of the inherent inability for the security engineer to dig down quickly to ascertain an alarm. All dashboards to be built will have built-in forensics capabilities to reduce response time

There are many more to come but we decided to start off with the six above and publish the App as 1.0.0 at the end of this month because the value is already there.

If you’re interested in downloading or joining our community, please email me directly or reach out on LinkedIn and I will get you access to our Cyences forum. Below are some screenshots and use cases.

Main Dashboard:

This dashboard is based on the MITRE framework
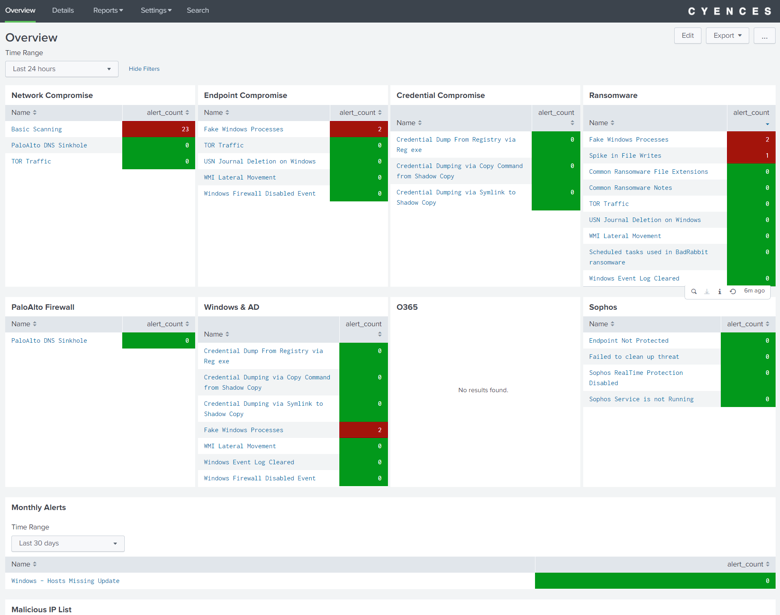
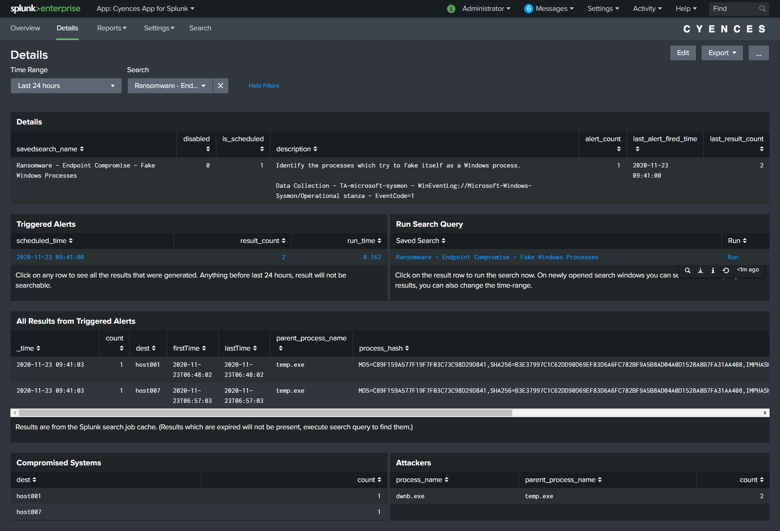
Fake Windows Processes

Some ransomware creates its executable file name as some default Windows process name to go undetected by the users. We can detect these processes because they will be installed outside the Windows default location.

Cyences App is showing attacker and compromised system information in the “Details” dashboard for easy access. 
Firewall Disabled (one of the first signs of an active attack)
Global Malicious IP List:

Written by Usama Houlila.

Any questions, comments, or feedback are appreciated! Leave a comment or send me an email to uhoulila@newtheme.jlizardo.com for any questions you might have.

Security Incident handling with Splunk – Preview to our new Cyences App to be published on Splunkbase

Nov 24, 2020 by Sam Taylor

Security Incident handling with Splunk – Preview to our new Cyences App to be published on Splunkbase

For the past year, customers have asked us to simplify Splunk so that they are able to identify nefarious activities quickly. In addition, they wanted to be able to forensically investigate any event without having to be experts in Splunk Processing Language (SPL).

During our initial meetings, we started to realize that the issue is not as simple as creating alerts and dashboards, but more of building a security engineer’s application for Splunk. Most security engineers understand what bad traffic and orchestration looks like, but they can’t navigate Splunk to get to the bottom of things, so we started developing the Cyences App which this blog previews. 

Overview:

The Cyences App was developed to achieve the following initial objectives with more to come on monthly basis.

  1. Community-based development starting with our existing clients and branching out to others soon afterwards
  2. Unified panes of glass that within one or two screens can provide a wholistic viewpoint of what’s important to be observed (if a certain correlation report doesn’t have an alert associated with it, it’s not necessary to be in the nefarious activity pane)
  3. Activity monitoring should include workstations and users (pre-COVID, this was not necessary, but offices and office firewalls currently play a small part in securing user activity)
  4. Global view: Collecting and correlating logs throughout a single organization is no longer sufficient because the activity becomes more of a reactive response vs. proactive. We decided that Cyences will collect Global Activity that is deemed nefarious and correlate all incoming and outgoing packets to decide with more accuracy whether something is wrong
  5. Drill down forensics: We found many existing dashboards and apps to be lacking because of the inherent inability for the security engineer to dig down quickly to ascertain an alarm. All dashboards to be built will have built-in forensics capabilities to reduce response time

There are many more to come but we decided to start off with the six above and publish the App as 1.0.0 at the end of this month because the value is already there.

If you’re interested in downloading or joining our community, please email me directly or reach out on LinkedIn and I will get you access to our Cyences forum. Below are some screenshots and use cases.

Main Dashboard:

This dashboard is based on the MITRE framework

Fake Windows Processes

Some ransomware creates its executable file name as some default Windows process name to go undetected by the users. We can detect these processes because they will be installed outside the Windows default location.

Cyences App is showing attacker and compromised system information in the “Details” dashboard for easy access. 
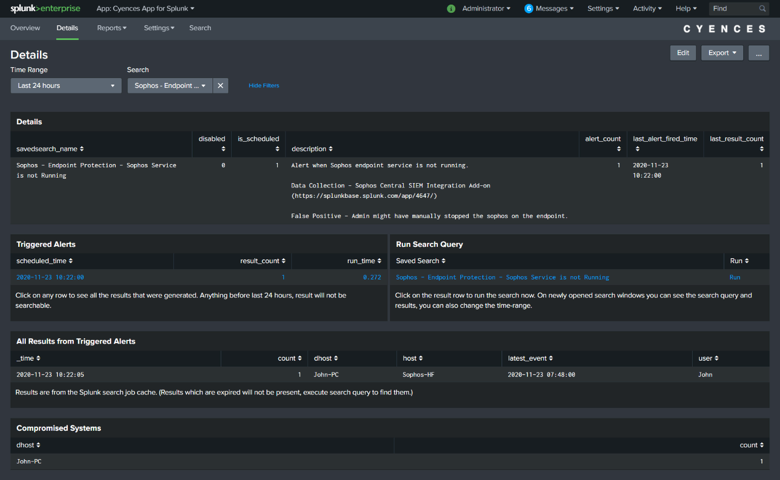
Firewall Disabled (one of the first signs of an active attack)
Global Malicious IP List:

Written by Usama Houlila.

Any questions, comments, or feedback are appreciated! Leave a comment or send me an email to uhoulila@newtheme.jlizardo.com for any questions you might have.
7 steps to improve your cyber resiliency

Nov 17, 2020 by Sam Taylor

Improve infrastructure cybersecurity through cyber resiliency

According to MITRE, “cyber resiliency” is “the ability to anticipate, withstand, recover from, and adapt to adverse conditions, stresses, attacks, or compromises on cyber resources.” Because no cybersecurity solution is infallible, cyber resiliency as an addition to a security approach is valuable in that it helps mitigate damage from cyber-attacks so operations can continue, and the possibility of interruption is reduced.

Benefits of cyber resiliency

Integrating cyber resiliency into an existing cybersecurity strategy, or as part of a new strategy, provides businesses with significant advantages:

  • Cyber resiliency reduces potential costs associated with cyber-attacks. According to Deloitte, even a low-end cyber-attack costing a cybercriminal $34 per month could return $25K, while more expensive attacks costing a few thousand dollars could return as much as $1M per month. IBM estimates that the average cost of a data breach is $3.86M.
  • Cyber resiliency assists in compliance with legal regulations. A strong example of this is the Network and Information Systems Directive which necessitates every business “take appropriate security measures and to notify serious incidents to the relevant national authority.” Also, consider the General Data Protection Regulation that vows to protect data privacy and restructure the way organizations approach it.
  • Cyber resiliency safeguards an organization’s reputation. An untarnished reputation lessens negative scrutiny, costly fines, a detrimental impact on securing new business and retaining business and the damaging of supplier relations. Not only will this negate an issue of trust and competency, but also eliminate any concerns to the protection of critical assets.
7 steps to improve your Cyber resiliency integration

Once the benefits of cyber resiliency are communicated to IT decision makers and buy-in has been established, the following seven steps will set you on the path to an improved cybersecurity strategy as outlined by the National Institute of Standards and Technology (NIST).

  • Step 1: Improve segmentation between systems based on criticality and trustworthiness. It is important to limit the number of targets that could potentially and easily spread malware.
  • Step 2: Provide multiple protected instances of critical resources. This will help decrease having to deal with the consequences of lost information or services. Be sure your organization can facilitate recovery from the effects of a cyber-attack and can reduce the amount of time during which critical services are limited, or even denied.
  • Step 3: Restrict privileges based on attributes of users and their workflow. It is important for businesses to lessen the possibility that actions by authorized employees will compromise information or services, likely unintentionally. Require that employees invest more time and effort in obtaining credentials, which will decrease an adversary’s ability
    to take full advantage of those credentials.
  • Step 4: Distribute and dynamically relocate functionality or system resources. Take steps to ensure your business can swiftly recover from non-adversarial events and that you are able to diminish an adversary’s ability to locate, eliminate or corrupt critical assets. The adversary will also have to spend more time finding those assets, which will likely reveal its intentions more quickly to an organization.
  • Step 5: Coordinate protection across the different layers/resources. Having these in place will require an adversary to put forth a great deal of effort to access the critical information/assets they seek which will increase the detection of the adversary. However, make sure that the use of any given protection mechanism does not create adverse, unintended consequences by interfering with other protection mechanisms.
  • Step 6: Monitor and analyze a wide range of properties and behaviors. Ongoing efforts towards monitoring and analysis allows organizations to maximize on detection of potential adverse conditions, as well as reveal the extent of potential or actual damage. Data will help support improved situational awareness.
  • Step 7: Implement agile cyber courses of action to manage risks. Enhance your company’s ability to respond to cyber-attacks in a timely and appropriate manner to ensure business operations are uninterrupted and destabilization is avoided.
The use of cyber resiliency as part of a larger cybersecurity strategy is instrumental in keeping companies as protected as possible, especially as sophistication of cyber-attacks increases. Cyber resiliency techniques continue to develop, so there will continue to be myriad of opportunities for today’s organizations to enhance and strengthen their security strategies.

Written by Usama Houlila.

Any questions, comments, or feedback are appreciated! Leave a comment or send me an email to uhoulila@newtheme.jlizardo.com for any questions you might have.

ABC’s of Splunk Part Twelve:
Protect yourself against Ransomware and Kernel-mode Malware

Oct 14, 2020 by Sam Taylor

Protecting your Windows Environment from Kernel-mode Malware

As we were looking to better protect the Windows environments from Ransomware, we quickly realized that very few security technologies have visibility into kernel-mode malware behavior. This type of malware has equal or even higher privileges than most security tools. Thus, attackers can essentially take safe refuge in the kernel, acting on nefarious intentions with little concern for getting caught. In looking at our options, we decided to go with System Monitor for many reasons to follow.

Sysmon is a Windows system service and device driver that can assist you in detecting advanced threats on your network by providing intricate host-operation details in real time. It provides detailed information about process creations, network connections and changes to file creation time. Most importantly, Sysmon can capture the more sophisticated kernel-mode malware. The list below published by Microsoft provides the details we were most interested in.

  • Logs process creation with full command line for both current and parent processes.
  • Records the hash of process image files using SHA1 (the default), MD5, SHA256 or IMPHASH.
  • Includes a process GUID in process to create events that allow for correlation of events, even when Windows reuses process IDs.
  • Includes a session GUID in each event to allow correlation of events on the same logon session.
  • Logs loading of drivers or DLLs with their signatures and hashes.
  • Logs opens for raw read access of disks and volumes.
  • Optionally logs network connections, including each connection’s source process, IP addresses, port numbers, host names and port names.
  • Detects changes in file creation time to understand when a file was really created. Modification of file create timestamps is a technique commonly used by malware to cover its tracks.
  • Automatically reloads configuration if changed in the registry.
  • Generates events from early in the boot process to capture activity made by even sophisticated kernel-mode malware.

Important Note: When we activated Sysmon on a live environment, the amount of Index usage exceeded 2GB a day; however, we have added the necessary filters here to reduce it to somewhere around ten thousand to one hundred thousand logs a day which will take an extremely small bite out of your license.

Prerequisites
  • This method will require Splunk Universal Forwarder or Splunk Heavy Forwarder to be installed and running on the Windows server.
  • Data Forwarding is configured from the Forwarder to Splunk Indexers.
Steps to Install and Configure Microsoft Sysmon
  • Download Sysmon Archive from here.
  • Extract the binary to your preferred location.
  • Download the file to the Directory where you have extracted from Sysmon.
  • Run Windows CMD or PowerShell in the Administrator mode.
  • Change the Sysmon config file.
    • In the Sysmon config file, the FileCreate section removes the extensions rule and adds a rule to include all the files from Sysmon based on drive letters. sysmon.exe -accepteula -i sysmonconfig-export.xml
    • Or take reference for Sysmon config file from here.
Collecting Data with Sysmon
  • After successfully configuring the Sysmon service, install the Splunk Add-on for Sysmon on your UF or HFW. Download the app from here.
  • Navigate to the $SPLUNK_HOME/etc/apps/TA-microsoft-sysmon/local. (Create a local directory if it doesn’t exist.)
  • Create a file named inputs.conf with the content below.
[WinEventLog://Microsoft-Windows-Sysmon/Operational]
disabled = false
renderXml = 1
index = epintel
  • Restart Splunk on the Forwarder.
This will start forwarding the Sysmon events to the indexer. Make sure to create an index named `eptel` on the indexer to receive the data.

Verify the Data Being Ingested

Run the below search-query on the search head:

index=epintel source=XmlWinEventLog:Microsoft-Windows-Sysmon/Operational

Data Reduction

By default, if you collect all the Sysmon data it will generate a huge amount of data as you will be collecting it from all the Windows hosts in your environment. This will consume licensing, too. Though Sysmon provides a lot of data, you likely don’t need most of it so you can filter the data to reduce the number of events coming in, which saves you Splunk licensing and storage.

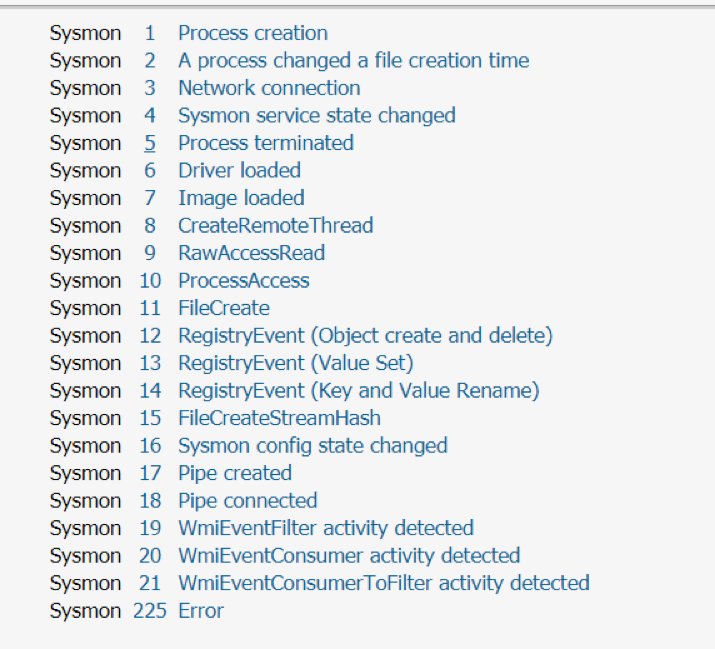
A list of EventIDs Sysmon generates:

For this example, we only need EventCodes 1, 2, 5 and 11.

Updated stanza to achieve this filtering add (whitelist = 1,2,5,11) parameter in the Sysmon input stanza.

[WinEventLog://Microsoft-Windows-Sysmon/Operational]
disabled = false
renderXml = 1
index = epintel
whitelist = 1,2,5,11
# Whitelisting only – Process creation(1), Process changed file creation time(2), Process terminated(5), FileCreated(11)


References

Ransomware Part-2 (More Use-Cases)

In case you haven’t installed the dependencies in your environment (Search Head), please look to the following:

  • Enterprise Security (optional)
    • People use correlation searches in ES for security incidents, but you can simply create an alert without having ES. Queries here use some macros built-in with ES.
  • Splunk Common Information Model (CIM)
    • It’s an App that we would need for some of the searches as those are based on CIM data models.
  • ES Content Update App
    • It’s a Splunk App that brings all these use-cases of Ransomware based on the MITRE framework.
    • Queries here use some macros that come built-in with ES

USN journal deletion

The fsutil.exe application is a Windows utility used to perform tasks related to the file allocation table (FAT) and NTFS file systems. The update sequence number (USN) change journal provides a log of all changes made to the files on the disk. This search looks for fsutil.exe deleting the USN journal.

Data Collection/

The data from Sysmon Operational Logs can be used to collect the processes data. Use Sysmon Add-on for Splunk for the data collection and field extraction.

Detection

Reference – From ES Content Update App – ESCU – USN Journal Deletion – Rule

| tstats `security_content_summariesonly` count values(Processes.process) as process values(Processes.parent_process) as parent_process min(_time) as firstTime max(_time) as lastTime from datamodel=Endpoint.Processes where Processes.process_name=fsutil.exe by Processes.user Processes.process_name Processes.parent_process_name Processes.dest | `drop_dm_object_name(Processes)` | `security_content_ctime(firstTime)`| `security_content_ctime(lastTime)` | search process=”*deletejournal*” AND process=”*usn*” | `usn_journal_deletion_filter`

Explanation

  • This detection query is based on the Processes dataset from the Endpoint data model.
  • The search will try to identify the “fsutil.exe” process and see if it is deleting the journal files.
  • This is only for Windows machines.

Fake Windows processes

Windows processes are normally run from Windows\System32 or Windows\SysWOW64. This search will try to find if there is a Window process running from some other location. This can indicate a malicious process trying to hide as a legitimate process.

Data Collection
We can use two options for data collection:

      1.  Sysmon Operational Logs
      2. Windows Security Logs

Detection

Reference – From Splunk Security Essentials App – Fake Windows Processes

| tstats `security_content_summariesonly` count values(Processes.process) as process values(Processes.parent_process) as parent_process min(_time) as firstTime max(_time) as lastTime from datamodel=Endpoint.Processes where Processes.process_name=fsutil.exe by Processes.user Processes.process_name Processes.parent_process_name Processes.dest | `drop_dm_object_name(Processes)` | `security_content_ctime(firstTime)`| `security_content_ctime(lastTime)` | search process=”*deletejournal*” AND process=”*usn*” | `usn_journal_deletion_filter`

Explanation

  • This detection query is based on the Processes dataset from the Endpoint data model.
  • The query is using a lookup named isWindowsSystemFile_lookup from the Security Essential App. The lookup determines whether the process is a Windows system file or not.

Scheduled tasks used in Bad Rabbit ransomware – Rule

This search looks for flags passed to schtasks.exe on the command-line that indicate that task names related to the execution of Bad Rabbit ransomware were created or deleted.

Data Collection

The data from Sysmon Operational Logs can be used to collect the processes data. Use Sysmon Add-on for Splunk for the data collection and field extraction.

Detection

Reference – From ES Content Update App – ESCU – Scheduled tasks used in Bad Rabbit ransomware – Rule

| tstats `security_content_summariesonly` count values(Processes.process) as process values(Processes.parent_process) as parent_process min(_time) as firstTime max(_time) as lastTime from datamodel=Endpoint.Processes where Processes.process_name=fsutil.exe by Processes.user Processes.process_name Processes.parent_process_name Processes.dest | `drop_dm_object_name(Processes)` | `security_content_ctime(firstTime)`| `security_content_ctime(lastTime)` | search process=”*deletejournal*” AND process=”*usn*” | `usn_journal_deletion_filter`

Explanation

  • This detection query is based on the Processes dataset from the Endpoint data model.
  • The query will try to search for the process name schtasks.exe from the data.
  • If the process is trying to search for the following keywords rhaegal, drogon or viserion_ that means there is presence of Ransomware in the environment

Macros

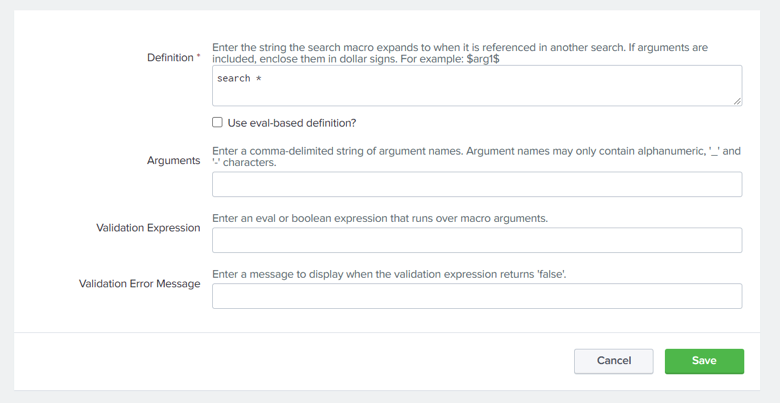
What are macros?

Search macros are reusable chunks of Search Processing Language (SPL) that you can insert into other searches. Search macros can be any part of a search, such as an eval statement or search term, and do not need to be a complete command. You can also specify whether the macro field takes any arguments.

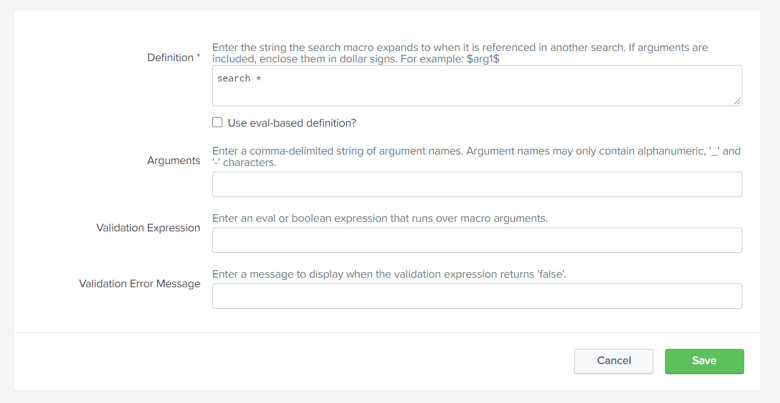
How to find/update the macro definition

  1.  Select Settings > Advanced Search > Search macros.
  2. Check that the App you are looking at is correct. If you don’t know the App, just select All.
  3. Type the macro name in the text filter and hit enter. That way you will be able to find the macro.


  4. Click on macro from the list.
  5. Edit/View the definition of macro in the opened Window.

  6. Click Save to save your search macro.

Macro Definitions

Here are some of the macros that are being used in above examples:

  •  `security_content_summariesonly`
    • Definition – summaryonly=false
    • Use summaryonly=true in case you have the data-models accelerated.
  • `drop_dm_object_name(Filesystem)`
    • Definition – rename FileSystem.* as *
  • `security_content_ctime(firstTime)`
    • Definition – convert timeformat=”%Y-%m-%dT%H:%M:%S” ctime(firstTime)
  • `security_content_ctime(lastTime)`
    • Definition – convert timeformat=”%Y-%m-%dT%H:%M:%S” ctime(lastTime)
  • `tor_traffic_filter`
    • Definition – search *
    • Update this macro definition in case you want to whitelist any traffic.
  • `usn_journal_deletion_filter`
    • Definition – search *
    • Update this macro definition in case you want to whitelist any events.
  • `system_processes_run_from_unexpected_locations_filter`
    • Definition – search *
    • Update this macro definition in case you want to whitelist any events.
  • `scheduled_tasks_used_in_badrabbit_ransomware_filter`
    • Definition – search *
    • Update this macro definition in case you want to whitelist any events.

This concludes our searches for this post. The macros definitions above are used in case you don’t have Enterprise Security licensing.

Happy Splunking!


Written by Usama Houlila.

Any questions, comments, or feedback are appreciated! Leave a comment or send me an email to uhoulila@newtheme.jlizardo.com for any questions you might have.
ABC’s of Splunk Part Eleven:
Ransomware and the Pyramid of Pain

Sep 16, 2020 by Sam Taylor

Since the beginning of the COVID-19 lockdown, we have witnessed an astonishing amount of attacks launched against remote workers. More and more companies have begun to pay perpetrators through a financial windfall that have allowed them to add more programmers to launch even more sophisticated attacks. Ransomware has become a full-on war than a skirmish.

Although there is no magic bullet to achieve resolution, we can utilize existing technologies to prevent and slow this parallel epidemic. Our focus is on addressing the entire pyramid of pain (David Bianco) and will be creating solutions for each level although not in any specific order.

For this post, we will start putting together the orchestration tools available on Splunk to detect common patterns that ransomware follows, looking specifically for this blog at four key tactics (Common File Extensions, Common Ransomware notes, High number of file writes, and wineventlogclearing) These are based on MITRE ATT&CK ransomware detection techniques. If you work in this field, we welcome your opinion and insights.

To start, we assume that your environment has the following:

  • Enterprise Security (optional)
    • If you have Enterprise Security (ES), you can use the correlation searches available for security incidents, but you can alternatively create alerts without having ES. Note: You must update some of the macro definitions – see at the end of the post.
  • Splunk Common Information Model

    • The Common Information Model (CIM) add-on contains a collection of preconfigured data models that you can apply to your data at search time.
  • ES Content Update App

    • This is a Splunk App that provides regular Security Content updates to help security practitioners address ongoing time-sensitive threats, attack methods and other security issues. Queries here use some macros that come built-in with ES.

Common file extension detection

This tactic will determine if there are any known ransomware file extensions present in the environment. Although the ransomware extensions can be changed in future attacks, similar to virus detection, all previous incidents should be carried forward.
Thought Process
  • This detection query is based on the Filesystem dataset from the Endpoint data model.
  • There is a lookup of commonly known extensions for ransomware encrypted files in the ES Content Update App, such as .8lock8, .encrypt, .lock93, etc.
  • Based on the comparison of file names from Sysmon data with the lookup of known ransomware file extensions, this correlation search will be able to detect the ransomware attack.
  • The ES Content Update App regularly updates the lookup with the latest known ransomware extensions.
Detection
Reference – From ES Content Update App – ESCU – Common Ransomware Extensions – Rule
| tstats `security_content_summariesonly` count min(_time) as firstTime max(_time) as lastTime values(Filesystem.user) as user values(Filesystem.dest) as dest values(Filesystem.file_path) as file_path from datamodel=Endpoint.Filesystem by Filesystem.file_name | `drop_dm_object_name(Filesystem)` | `security_content_ctime(lastTime)` | `security_content_ctime(firstTime)`| rex field=file_name “(?\.[^\.]+)$” | `ransomware_extensions` | `common_ransomware_extensions_filter`

Common ransomware notes

This tactic will find out if there are any known ransomware file names for ransomware notes present in the environment. The ransomware notes are kept by the attacker to provide a guide for the victim on how to pay for the ransom and how they will get their data back.

Data Collection

We’ll be using Sysmon data for this as well.

Thought Process
  • This detection query is based on the Filesystem dataset from the Endpoint data model.
  • There is a lookup of commonly known names of ransomware notes file in the ES Content Update App like HELP_TO_SAVE_FILES.txt, READ IF YOU WANT YOUR FILES BACK.HTML, etc.
  • Based on the comparison of file names from Sysmon data with the lookup of known ransomware notes, this correlation search will be able to detect the ransomware attack.
  • The ES Content Update App regularly updates the lookup with the latest known ransomware notes.
Detection

Reference – From ES Content Update App – ESCU – Common Ransomware Extensions – Rule

| tstats `security_content_summariesonly` count min(_time) as firstTime max(_time) as lastTime values(Filesystem.user) as user values(Filesystem.dest) as dest values(Filesystem.file_path) as file_path from datamodel=Endpoint.Filesystem by Filesystem.file_name | `drop_dm_object_name(Filesystem)` | `security_content_ctime(lastTime)` | `security_content_ctime(firstTime)`| rex field=file_name “(?\.[^\.]+)$” | `ransomware_extensions` | `common_ransomware_extensions_filter`

High number of file writes

How does ransomware work?
It identifies important files in the system and then encrypts those files into a new file and removes the original files. Knowing what it does, we understand that ransomware has to write a lot of encrypted files in the system. This will create a spike in the number of files being written to the system, which is another way we can identify the ransomware attack.
Data Collection
We’ll be using Sysmon data for this as well.
Thought Process
  • This detection query is based on the Filesystem dataset from the Endpoint data model.
  • Query tries to detect outliers in the number of files being written in the system.
  • How does it detect the outlier/spike?
    • It identifies the number of files being written in any one-hour span.
      • It calculates the below items:
      • Previous (prior to today) avg. write count = avg
      • Previous (prior to today) standard deviation write count = stdev
      • Maximum write count today = count
    • Then it will calculate upper bound.
      • Upper bound = (avg+stdev*4)
    • If the count (maximum write today) is more than the upper bound, then that is an outlier.
    • Note: We will be adjusting these calculations as time progresses to reduce the number of false positives.
Detection
Reference – From ES Content Update App – ESCU – Common Ransomware Extensions – Rule
| tstats `security_content_summariesonly` count min(_time) as firstTime max(_time) as lastTime values(Filesystem.user) as user values(Filesystem.dest) as dest values(Filesystem.file_path) as file_path from datamodel=Endpoint.Filesystem by Filesystem.file_name | `drop_dm_object_name(Filesystem)` | `security_content_ctime(lastTime)` | `security_content_ctime(firstTime)`| rex field=file_name “(?\.[^\.]+)$” | `ransomware_extensions` | `common_ransomware_extensions_filter`
Known False Positives
It is important to understand that if you happen to install any new applications on your hosts or are copying a large number of files, you can expect to see a large increase in file modifications.

Wineventlog clearing

Based on various published reports, the ransomware takes the step of clearing the event logs shortly after infection. This will make it difficult to investigate the attack. Searching for this can help you identify systems that may have been impacted.

Data Collection

For data collection, we’ll have to use Windows Security Eventlog data. Please make sure to install the windows add-on.

Note: You have to enable the below input stanzas in the Windows Add-on (inputs.conf).

[WinEventLog://Security]

[WinEventLog://System]

Thought Process
  • This detection query is based on the WinEventLog data.
  • wineventlog_security` – Index/indexes for wineventlog security data. (Macro definition – see below)
  • wineventlog_system` – Index/indexes for wineventlog system events. (Macro definition –see below)
    • EventIDs used here:
    • EventID=1102 – WinEventLog (audit log) was cleared
    • EventID=1100 – WinEventLog is disabled
    • EventID=104 – The log file was cleared
Detection

Reference – From ES Content Update App – ESCU – Common Ransomware Extensions – Rule

(`wineventlog_security` (EventID=1102 OR EventID=1100)) OR (`wineventlog_system` EventID=104) | stats count min(_time) as firstTime max(_time) as lastTime by EventID dest | `security_content_ctime(firstTime)` | `security_content_ctime(lastTime)` | `windows_event_log_cleared_filter`
Known False Positives

These logs may be legitimately cleared by Administrators.


Macros

What are macros?

Search macros are reusable chunks of Search Processing Language (SPL) that you can insert into other searches. Search macros can be any part of a search, such as an eval statement or search term, and do not need to be a complete command. You can also specify whether the macro field takes any arguments.

How to find/update macro definition?
  1. Select Settings > Advanced Search > Search macros.
  2. Check the App is correct that you are looking at. If you don’t know the App, just select All.
  3. Type the macro name in the text filter and hit enter. That way you will be able to find the macro.
  4. Click on macro from the list.
  5. View/Edit the definition of macro in the opened Window.
  6. Click Save to save your search macro

This concludes our searches for this post. The macros definitions below are used in case you don’t have Enterprise Security licensing.


Happy Splunking!


Written by Usama Houlila.

Any questions, comments, or feedback are appreciated! Leave a comment or send me an email to uhoulila@newtheme.jlizardo.com for any questions you might have.
ABC’s of Splunk Part Ten:
Reduction of Attack Surface Area
Windows and Microsoft Active Directory

Sep 16, 2020 by Sam Taylor

For this blog, we are going to go over how to ingest our windows environment and Active Directory logs and how to set up advanced search commands to continue with our efforts to reduce our attack surface area. This issue has gained importance since last week after the discovery of a new set of exploits that Microsoft cannot seem to be able to patch in time and instead is installing workarounds. Splunk is a great tool in these scenarios because you can create real-time alerts that would discover and mitigate automatically all the time.

How to collect the data

Splunk Add-on for Windows will allow you to collect all the data related to Active Directory and Windows Event Logs.

Download from SplunkbaseDocumentation 

The data it collects

  • Performance Data (CPU, I/O, Memory, etc.)
  • Windows Event log
  • Active Directory and Domain Name Server debug logs from Windows hosts that act as domain controllers.
    Please note: you must configure the Active Directory audit policy since Active Directory does not log certain events by default.
  • Domain Name Server debug logs from Windows hosts that run a Windows DNS Server. Please note: Windows DNS Server does not log certain events by default so you must enable debug logging.

Note – If you don’t know what Windows Event Logging is and what data it can provide, please refer to Event Logging (Event Logging) – Win32 apps.

Where and how to install the Add-on

Universal Forwarder
Heavy Forwarder
  • If your data is flowing from Universal Forwarder to a Heavy Forwarder then you have to install the Splunk Add-on for Windows on your Heavy Forwarder.
  • Note that you do not have to make any configuration on Heavy Forwarder.
Indexers
  • If your data is flowing from Universal forwarder to Indexers directly, then you have to install the Splunk Add-on for Windows on Indexers.
  • Note there is no need to make any configuration on Indexers.
Search Head
  • Install the Splunk Add-on for Windows on the Search Head for field extraction.
  • Note that configuration is not needed on the Search Head.
References

How to configure the Add-on

Follow the below steps to configure the inputs:
  1. $SPLUNK_HOME/etc/apps/Splunk_TA_Windows ($SPLUNK_HOME/etc/deplotment-apps/Splunk_TA_Windows for Deployment Server)
  2. Create a local directory, if it does not exist already.
  3. Copy inputs.conf file from the default directory into the local directory.
  4. Edit the inputs.conf from the local directory.
  5. Add/update the disabled property for any stanza to enable or disable data collection for the different stanza.
  6. Add the index parameter in all the stanza to collect the data in a specific index. (Recommended index names are wineventlog, windows, and msad)
References

How to visualize/understand the data

Splunk App for Windows Infrastructure

The Splunk App for Windows Infrastructure is a very good way to see your Windows and AD data. The App is created by Splunk.
Download  |  Documentation

Install
  1. You only have to install this App on the Search Head. Download the App from Splunkbase and install it on the Search head.
  2. Download and install Splunk Supporting Add-on for Active Directory.
  3. Enable proper roles for the user.
    1. In the system bar, click Settings > Access controls.
    2. Click Users.
    3. Click the user that will run the application. Splunk Enterprise displays the information page for the user.
    4. In the Assign to roles section, in the Available roles column, click winfra-admin role. The role moves from the Available roles to the Selected roles column.
    5. Click Save.
    6. Follow the steps for all the users you want to give access to use the Windows Infrastructure App.
References

Configuration

You have to follow the step-by-step wizard within the App to configure the App.
Navigate to Splunk UI and Open the Splunk App for Windows Infrastructure.

References

MS Windows AD Objects

The MS Windows AD Objects App is another good App to visualize the data. You can use it with the Windows Infrastructure App. The MS Windows AD Objects App will give a better option to audit admin activities in AD and Windows.
Download  |  Documentation
Install

You only have to install this App on the Search Head.
Download the App from Splunkbase and install it on the Search Head.

You must enable the below inputs on the Splunk Add-on for Windows on all the AD servers to make the App work. (See How to configure the Add-on? )

  • [admon://default]
  • disabled = 0
  • monitorSubtree = 1
  • baseline = 1
  • index=msad
References
Configuration

Follow the step-by-step wizard within the App for configuration.
Navigate to Splunk UI and Open the MS Windows AD Objects App.

Reference

How to get alerts related to events occurring on the Windows Server or on the Active Directory

Here I’ve added some of the examples (including search queries) that may give you a great start for your use-cases with Windows/Active Directory and Splunk.

1. Windows – Alert on Firewall changes on Windows Servers

This alert will tell you if there have been any firewall related changes on any of the Windows servers.

Query

(index=wineventlog OR index=windows OR index=msad) sourcetype=”XmlWinEventLog” source=”XmlWinEventLog:Security” EventCode=4950 | table host, EventCode, ProfileChanged, SettingType, SettingValue

Alert Type – Scheduled
TimeRange – Last 60 Minutes
Cron Expression – 15 * * * *

2. AD – Password change outside working hours

This alert will trigger if someone tried to change the AD password outside the working hours.
The outside Working Hours is defined as “Saturday, Sunday and any day before 6 AM and after 7 PM”. Though you can modify the query here to change the definition of outside working hours.

Query

(index=windows OR index=wineventlog OR index=msad) source=”WinEventLog:Security” EventCode IN (628, 4742, 627, 4723)
| eval date_wday = strftime(_time, “%A”), date_hour = tonumber(strftime(_time, “%H”)) | where date_wday=”Saturday” OR date_wday=”Sunday” OR date_hour<6 OR date_hour>19 | table _time, user, Account_Domain, Account_Name, msad_action, action, Password_Last_Set, EventCode, EventCodeDescription

Alert Type – Scheduled
TimeRange – Last 24 Minutes
Cron Expression – 07 * * * *

3. AD – Alert to show any authority changes in AD privilege

This alert will trigger when there is any privilege escalation (User added/removed to/from a group) on AD.

Query

(index=windows OR index=msad OR index=wineventlog) EventCode IN (4728, 4729) | table host, change_action, Group_Name, member, EventCodeDescription

Alert Type – Scheduled
TimeRange – Last 60 Minutes
Cron Expression – 5 * * * * (Runs every hour)

4. AD – User Modification

This alert will trigger when there is any user modification on AD, that includes any user created, deleted, enabled and disabled.

Query

(index=windows OR index=msad OR index=wineventlog) source=”WinEventLog:Security” EventCode IN (4722, 4725, 4720, 4726) user!=*$ | table _time, host, user, name, EventCode | rename subject as Action

Alert Type – Scheduled
Timerange – Last 5 Minutes
Cron Expression – */5 * * * * (Runs every 5 minutes)

Happy Splunking!


Written by Usama Houlila.

Any questions, comments, or feedback are appreciated! Leave a comment or send me an email to uhoulila@newtheme.jlizardo.com for any questions you might have.

ABC’s of Splunk Part Nine: Reduction of Attack Surface Area

Sep 9, 2020 by Sam Taylor

For this post, we take a little side trip to explore Splunk as a tool for early identification of areas vulnerable to attacks so we can reap the benefits of all our learnings and extract valuable information as to what makes Splunk powerful from a SIEM perspective. Please revisit our previous posts if you would like to learn more

As more clients move on-prem technology systems to the cloud, the attack surface area increases tremendously because instead of utilizing a local provider or their own computer room (small surface area) for hosting, they migrate to bigger systems and workloads that can dynamically move from one data center to another, with scalability the primary focus over security. In at least three scenarios I witnessed this year alone, the ability to access the necessary logs in less than 24 hours was almost impossible, which led me to begin identifying the actions we must take to reduce our attack surface area – or at least have better logs and controls to reduce exposure.

Let’s discuss how to collect the logs from Microsoft Office 365 (O365) in nearly real time (expect 5 to 25-minute delays) and how to set up alerts for when a successful login occurs outside a user’s normal geographic region. In a default manner, Splunk will sometimes in error detect a failed login as successful because the logs from O365 will show “successful” for an account that doesn’t exist, but with proper filtering (follow below), you will be able to see the real logins.

Time to dig in!

How to collect the data

Two Add-ons must be installed for O365:

Splunk Add-on for O365 

Download from Splunkbase

Documentation

What data does it collect?

  • Service status (Historical and current service status)
  • Service messages
  • Management activity logs (Data Loss Prevention events)
  • Audit logs for Azure Active Directory, SharePoint Online and Exchange Online

Splunk Add-on for O365 Reporting

Download from Splunkbase

Documentation/Installation/Configuration

What data does it collect?

  • Message Trace (Summary information about the processing of email messages that have passed through the O365 system)

Index Configuration

For this blog, we have used index=o365.

How to visualize/understand the data

The Microsoft 365 App for Splunk or Microsoft Cloud App needs to be installed – Microsoft 365 App for Splunk

The App also has some dependent Apps that must be installed on your Search Head. These are custom visualization charts to better view the data.


Configuration

Though the App does not require any configuration, the recommendation is to update index-macro to increase search performance. As mentioned above, we have used index=o365.

  1. Navigate to Settings > Advanced search > Search macros
  2. Select “Microsoft 365 App for Splunk” in the App list
  3. Type “m365_default_index” in filter
  4. Click on m365_default_index from the list below
  5. Update the Definition from “index=*” to “index=0365”
  6. Save

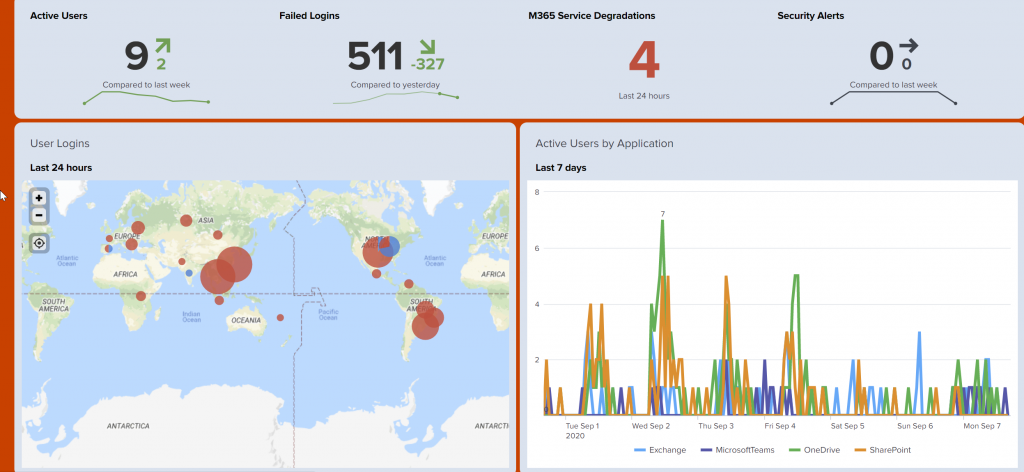
Your Microsoft 365 App should display something like this:

Browse the App and all the different screens to develop a strong understanding of what information is being collected.

How to get alerts related to notable events occurring on the O365

We can also write alerts to get notified as early as possible with Splunk alerts. Added below are some of the examples (including search queries) that may give you a great start for your use-cases with O365 security with Splunk.

  1. Azure login failure outside the US due to multi-factor authentication

This alert will tell you if someone fails the two-factor authentication with Azure/O365 outside the US.

Query

index=o365 _index_earliest=-15m@s _index_latest=now sourcetype=”o365:management:activity”Workload=AzureActiveDirectory Operation=UserLoginFailed (LogonError=”DeviceAuthenticationRequired” OR LogonError=”UserStrongAuthClientAuthNRequiredInterrupt”) | stats count, latest(ClientIP) as ClientIP, values(_time) as _time by UserId | where count > 1 | eval _time=strftime(_time, “%F %T”) | iplocation ClientIP | search Country!=”United States” | makemv _time delim=”,”

Alert Type – Scheduled

Timerange – Last 24 Hours

Cron Expression – */15 * * * *

  1. Azure login from an unknown user

This alert will tell you if there are logins from unknown users on Azure/O365.

Query

index=o365 sourcetype=”o365:management:activity” Workload=AzureActiveDirectory Operation=UserLoggedIn UserId=Unknown | iplocation ClientIP | table _time, ClientIP, City, Region, Country, Operation, Region, UserId

Alert Type – Scheduled

Timerange – Last 5 Minutes

Cron Expression – */5 * * * *

  1. Azure success login outside the US

This alert will tell you if someone logs in from outside the US.

Query

index=o365 _index_earliest=-5m@s _index_latest=now sourcetype=”o365:management:activity” Workload=AzureActiveDirectory Operation=UserLoggedIn NOT LogonError=* |iplocation ClientIP | search Country!=”United States” | table _time, ClientIP, City, Region, Country, UserId

Alert Type – Scheduled

Timerange – Last 24 Hours

Cron Expression – */5 * * * *

If you know of different alerts that can benefit the community, please reply to this post and/or shoot me an email to be published in the comment section and/or in our next post. We’re all ears if there is a system you want us to tackle next, and we will make it happen as soon as possible.

Happy Splunking!


Written by Usama Houlila.

Any questions, comments, or feedback are appreciated! Leave a comment or send me an email to uhoulila@newtheme.jlizardo.com for any questions you might have.
ABCs of Splunk, Part 8: Advanced Search

Sep 2, 2020 by Sam Taylor

In this post, we will continue our journey into search with Splunk and add a few more commands to include in your arsenal of knowledge. Please revisit our previous posts to ensure you have a healthy environment upon which to run commands.

Prerequisite

How to Install Splunk on Linux

Upload data required for the examples in this post.

  1. Download Tutorials.zip and Prices.csv.zip to your machine.
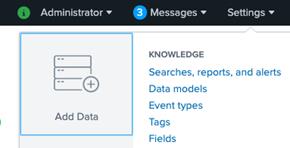
  2. Log in to Splunk Web. Go to Settings. On the settings page click on Add Data in the left pane.
  1. On the Add Data page click on the Upload
  2. On the file upload page select or drag and drop files/archives that you have downloaded (one-by-one). You do not have to extract the archive.
  3. After the upload is finished click on Next
  4. Select the source type as “Auto.”
  5. In the Host name extract field, use the Segment with value as 1 if you have Splunk running on Linux system. If you have Splunk running on Windows system use regular expression-based extract with regex value as \\(.*)\/.
  6. Create and select a new Index “test.”
  7. Complete the upload for both the files.

Searching and filtering

Commands in this category are used to search for various events and apply filters on them by using some pre-defined criteria.

Searching and filtering commands:

  • Search
  • Dedup
  • Where
  • Eval

Search

The search command is used to retrieve events from indexes or to filter the results of a previous search command in the pipeline. 

You can retrieve events from your indexes by using keywords, quoted phrases, wildcards and key/value expressions. 

The search command is implied at the beginning of any search. You do not need to specify the search command at the beginning of your search criteria.

Order does not matter for criteria.

index=test host=www*

Is the same as

host=www* index=test

Quotes are optional for search command, but you must put quotes when the values contain spaces.

index=test host=”Windows Server”

Dedup

The dedup command removes the events that contain an identical combination of values for the fields that you specify. 

With dedup, you can specify the number of duplicate events to keep for each value of a single field or for each combination of values among several fields. Events returned by dedup are based on search order.

Remove duplicate search results with the same host value.

index=test | dedup host

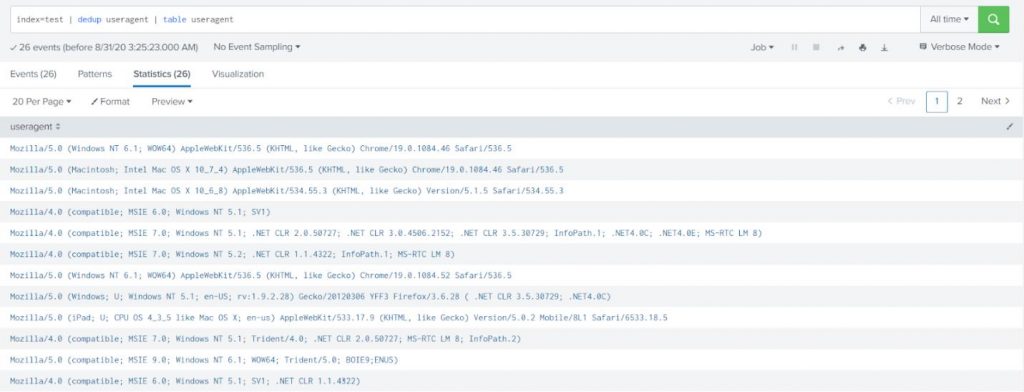
Get all user agents under index test.

index=test | dedup useragent | table useragent

Where

The where command performs arbitrary filtering on the data and uses eval expressions to filter search results. The search keeps only the results for which the evaluation was successful (that is, the Boolean result = true).

The where command uses the same expression syntax as the eval command. Also, both commands interpret quoted strings as literals. If the string is not quoted it is treated as a field name. Use the where command when comparing two different fields, as this cannot be done by using the search command.

Command

Example

Description

Where

… | where foo=bar

This search looks for events where the field foo is equal to the field bar.

Search

| search foo=bar

This search looks for events where the field foo contains the string value bar.

Where

… | where foo=”bar”

This search looks for events where the field foo contains the string value bar.

Example-1:

Find the events with ProductID starts with the value WC-SH-A.

index=test | where like(productId, “WC-SH-A%”)

You can only specify a wildcard (% sign) with the where command by using the “like” function. 

Example-2:

Search the events with failed HTTP response (HTTP response status can be found with field name status).

index=test | where status!=200

Eval

The eval command is used to add new fields in the event by using existing fields from the event and arbitrary expressions. The eval command calculates an expression and puts the resulting value into a search results field.

If the field name that you specify does not match a field in the output, then a new field is added to the search results.

If the field name you specify matches a field name that already exists in the search results, then the results of the eval expression overwrite the values for that field.

The eval command evaluates mathematical, string, and boolean expressions.

Example-1:

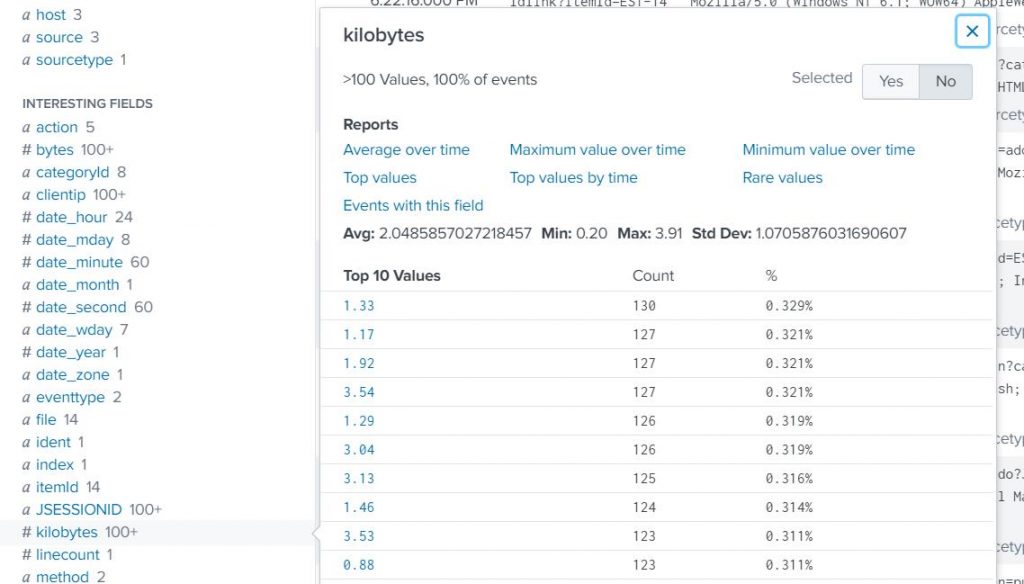
Convert the response size from bytes into kilobytes (tutorials data (sourcetype=access*) consisting of web server logs that contain a field named bytes, which represents the response size).

index=test sourcetype=access* | eval kilobytes=round(bytes/1024,2)

Example-2:

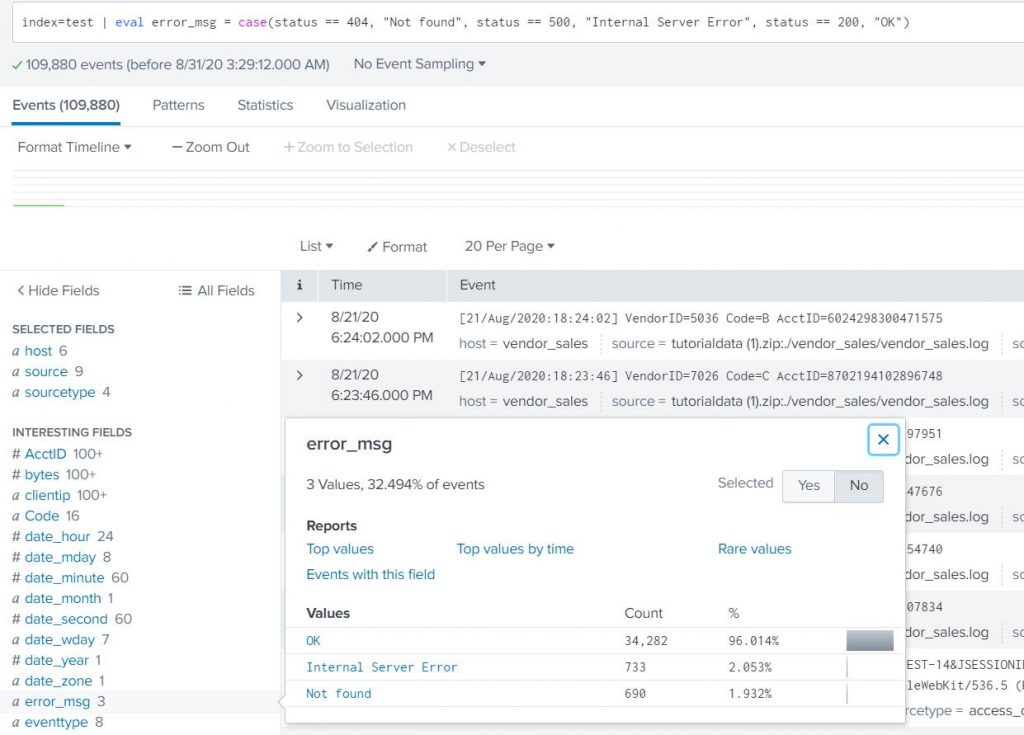
Create a field called error_msg in each event. Distinguish the requests based on the status code. Status 200 is okay, 404 is page not found, 500 is an internal server error (hint – use case statement with field status).

index=test | eval error_msg = case(status == 404, “Not found”, status == 500, “Internal Server Error”, status == 200, “OK”)


Formatting and ordering

These commands are used to reformat the search results and order them based on the field values.

Formatting and ordering commands:

  • Rename
  • Table and Fields
  • Sort

Rename

The rename command is used to rename one or more fields and is useful for giving fields more meaningful names, such as Process ID instead of pid

If you want to rename fields with similar names, you can use a wildcard character.

You cannot rename one field with multiple names. For example, if you have field A, you cannot specify | rename A as B, A as C.

Renaming a field can cause loss of data. Suppose you rename field A to field B, but field A does not exist. If field B does not exist, then nothing happens. If field B does exist, then the result of the rename is that the data in field B will be removed. The data in field B will contain null values.

Note – Use quotation marks when you rename a field with a phrase.

Example-1:

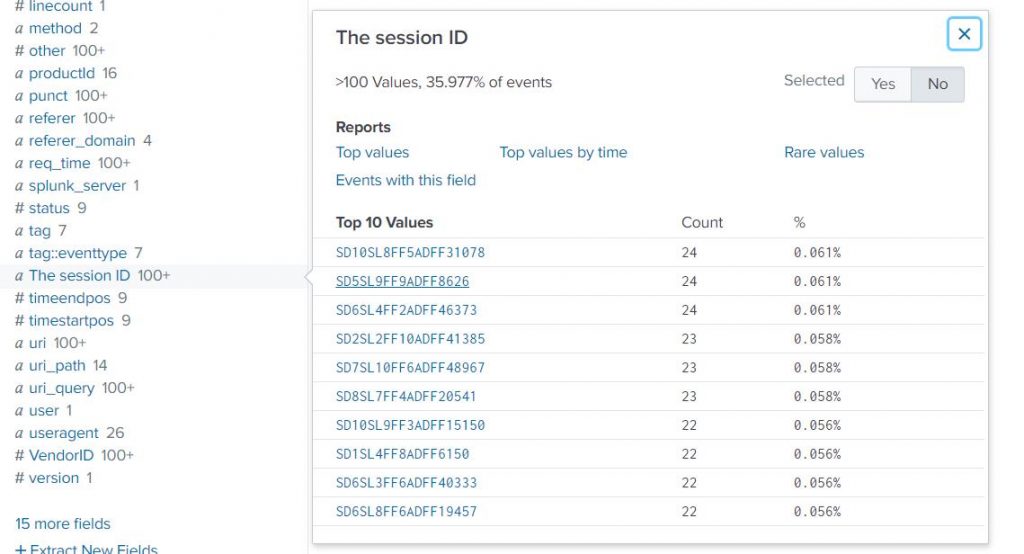
Rename field named JSESSIONID into a human-readable format. 

index=test | rename JSESSIONID AS “The session ID”

Example-2:

Rename the clientip field to “IP Address”.

index=test | rename clientip AS “IP Address”

Table and fields

The table command is a formatting command and returns a table that is formatted by only the fields that you specify in the arguments. Columns are displayed in the same order that fields are specified. Column headers are the field names. Rows are the field values. Each row represents an event.

The fields command is a filtering command.

The fields command can keep or remove fields from/to the results.

… | fields – A, B – Removes field A and B

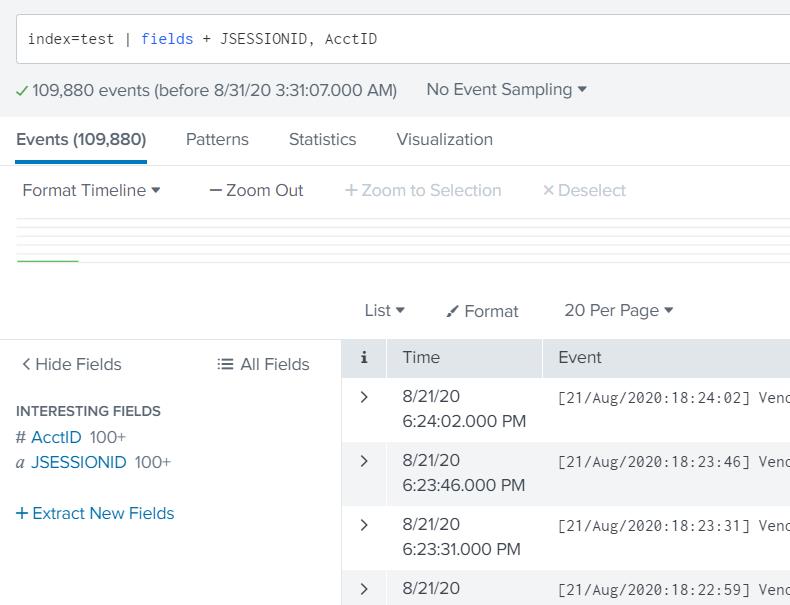
… | fields + A, B – Keeps field A and B and removes all other fields from the results

index=test | fields + JSESSIONID, AcctID

Sort

The sort command sorts all the results by the specified fields. Results missing a given field are treated as having the smallest or largest possible value of that field if the order is descending or ascending, respectively.

If the first argument to the sort command is a number, then at most that many results are returned in order. If no number is specified, then the default limit of 10000 is used. If the number 0 is specified, then all the results are returned. See the count argument for more information.

By default, the sort command automatically tries to determine what it is sorting. If the field takes on numeric values, the collating sequence is numeric. If the field takes on IP address values, the collating sequence is for IPs. Otherwise, the collating sequence is in lexicographical order. 

Some specific examples are:

  • Alphabetic strings and punctuation are sorted lexicographically in the UTF-8 encoding order.
  • Numeric data is sorted in either ascending or descending order.
  • Alphanumeric strings are sorted based on the data type of the first character. If the string starts with a number, then the string is sorted numerically based on that number alone. Otherwise, strings are sorted lexicographically.
  • Strings that are a combination of alphanumeric and punctuation characters are sorted the same way as alphanumeric strings.

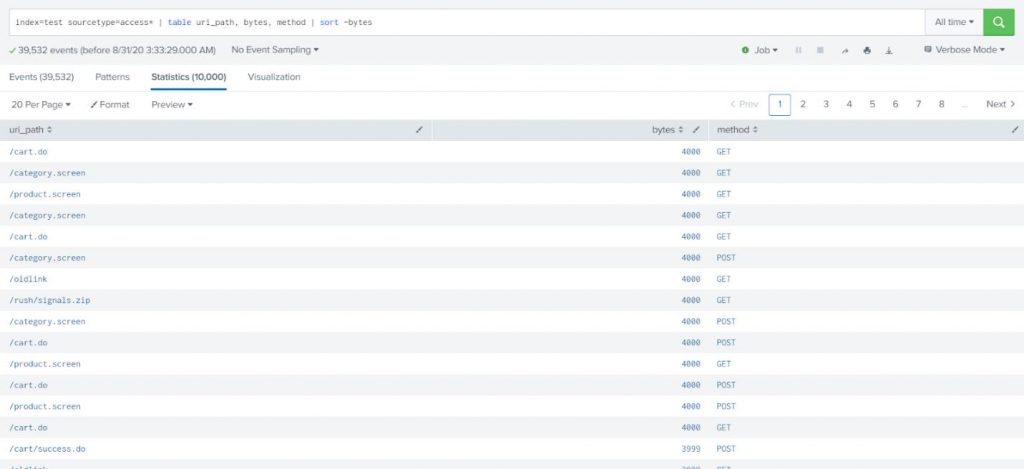
Example-1:

Sort results of web accesses by the request size (descending order).

index=test sourcetype=access* | table uri_path, bytes, method | sort -bytes

Example-2:

Sort web access data sort in ascending order of HTTP status code.

index=test sourcetype=access* | table uri_path, bytes, method, status | sort status

Reporting

These commands are used to build transforming searches andreturn statistical data tables that are required for charts and other kinds of data visualizations.

Reporting commands:

  • Stats
  • Timechart
  • Top

Advanced Commands:

  • Stats vs eventstats vs streamstats
  • Timechart vs chart

Stats

The stats command calculates aggregate statistics such as average, count, and sum, over the results set, similar to SQL aggregation. 

If the stats command is used without a BY clause only one row is returned, it is the aggregation over the entire incoming result set. If a BY clause is used, one row is returned for each distinct value specified in the BY clause.

Example-1:

Determine the average request size served in total for each host.

index=test sourcetype=access* | stats avg(bytes) BY host

Example-2:

You can also rename the new field to another field name with the stats command.

index=test sourcetype=access* | stats count(eval(status=”404″)) AS count_status BY sourcetype


Timechart

A timechart is a statistical aggregation applied to a field to produce a chart with time used as the X-axis. 

You can specify a split-by field where each distinct value of the split-by field becomes a series in the chart.

The timechart command accepts either the bins OR span argument. If you specify both bins and span, span will be used and the bins argument will be ignored.

If you do not specify either bins or span, the timechart command uses the default bins=100.

Example-1:

Display column chart over time to show number of requests per day (use web access data, sourcetype=access*).

index=test sourcetype=access* | timechart span=1d count

See Visualization and select “column chart”

Example-2:

Show the above data with different lines (in a chart) grouped by file. In other words, show the number of requests per file (see field name file) in the same chart.

index=test sourcetype=access* | timechart span=1d count by file

See visualization and select “line chart”.

Top

Top finds the most common values for the fields in the field list. It calculates a count and a percentage of the frequency the values occur in the events. 

If the is included, the results are grouped by the field you specify in the .

  • Count – The number of events in your search results that contain the field values that are returned by the top command. See the countfield and showcount arguments.
  • Percent – The percentage of events in your search results that contain the field values that are returned by the top command. See the percentfield and showperc arguments.

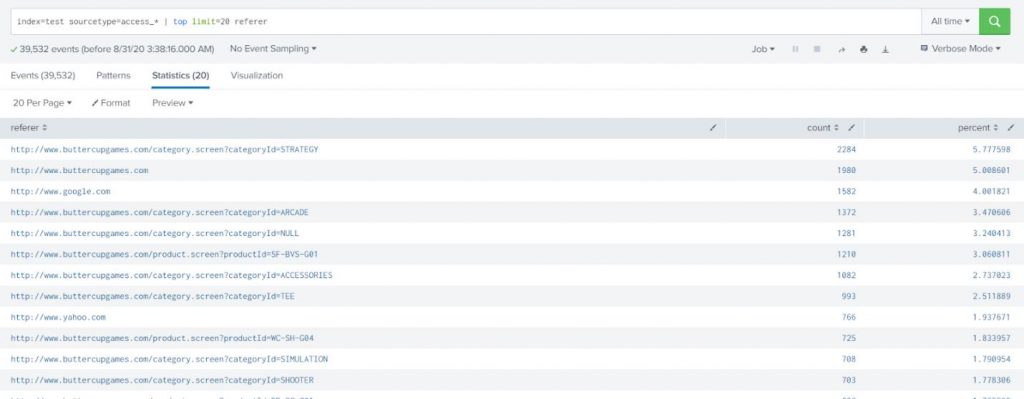
Example-1:

Write a search that returns the 20 most common values of the referer field. 

index=test sourcetype=access_* | top limit=20 referer

The results show the top 20 referer events by count and include the total percentage.

Streamstats

The streamstats command adds cumulative summary statistics to all search results in a streaming manner, calculating statistics for each event at the time the event is seen. For example, you can calculate the running total for a particular field. The total is calculated by using the values in the specified field for every event that has been processed up to the last event.

  • Indexing order matters with the output.
  • It holds memory of the previous event until it receives a new event.

Example:

Compute the total request size handled by the server over time (on day 1 the value should be the total of all the requests, on day 2 the size should be the sum of all the requests from both day 1 and day 2).

Use web access data (sourcetype=access*).

index=test sourcetype=access* | sort +_time| streamstats sum(bytes) as total_request_handled | eval total_GB=round(total_request_handled/(1024*1024),2) | timechart span=1d max(total_GB)

Eventstats

Eventstats generate summary statistics from fields in your events in the same way as the stats command but save the results as a new field instead of displaying them as a table.

  • Indexing order does not matter with the output.
  • It looks for all the events at a time then computes the result.

Stats vs eventstats

Stats

Eventstats

Events are transformed into a table of aggregated search results.

Aggregations are placed into a new field that is added to each of the events in your output.

You can only use the fields in your aggregated results in subsequent commands in the search.

You can use the fields in your events in subsequent commands in your search because the events have not been transformed.

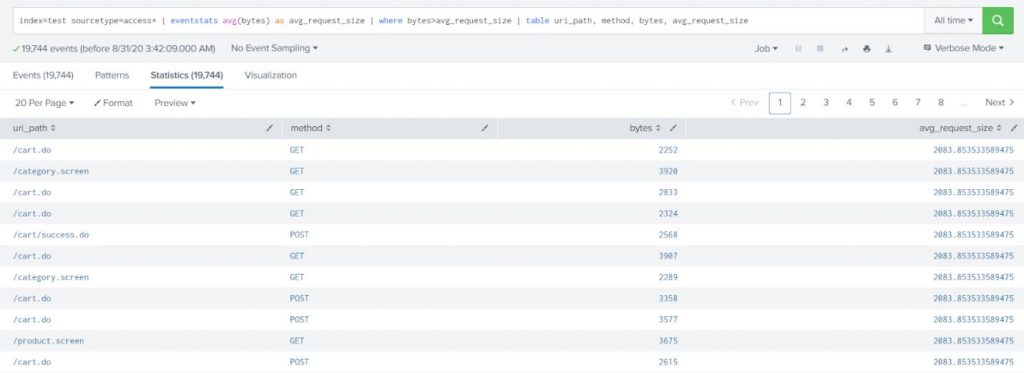
Example:

Show all the web access requests which have request size greater than the average size of all the requests.

index=test sourcetype=access* | eventstats avg(bytes) as avg_request_size | where bytes>avg_request_size | table uri_path, method, bytes, avg_request_size

Correlation commands

These commands are used to build correlation searches. You can combine results from multiple searches and find the correlation between various fields.

Event correlation allows you to find relationships between seemingly unrelated events in data from multiple sources and to help understand which events are most relevant.

Correlation commands:

  • Join
  • Append
  • Appendcol

Advanced Correlation commands:

  • Appendpipe
  • Map

Join

Use the join command to combine the results of a subsearch with the results of the main search. One or more fields must be in common for each result set.

By default, it performs the inner join. You can override the default value using the type option of the command.

To return matches for one-to-many, many-to-one or many-to-many relationships include the max argument in your join syntax and set the value to 0. By default max=1, which means that the subsearch returns only the first result from the subsearch. Setting the value to a higher number or to 0, which is unlimited, returns multiple results from the subsearch.

Example:

Show vendor information (sourcetype=vendor_sales) with complete product details (details about the product can be found from sourcetype=csv) including product name and price.

index=test sourcetype=vendor_sales | join Code [search index=test sourcetype=csv] | table VendorID, AcctID, productId, product_name, sale_price

Append

The append command adds the results of a subsearch to the current results. It runs only over historical data and does not produce the correct results if used in a real-time search.

Example-1:

Count the number of different customers who purchased something from the Buttercup Games online store yesterday and display the count for each type of product (accessories, t-shirts, and type of games) they purchased. Also, list the top purchaser for each type of product and how much product that person purchased. Append the top purchaser for each type of product and use the data from the source prices.csv.zip.

index=test sourcetype=access_* action=purchase | stats dc(clientip) BY categoryId | append [search index=test sourcetype=access_* action=purchase | top 1 clientip BY categoryId] | table categoryId, dc(clientip), clientip, count

Explanation:

In this example, the first searches are for purchase events (action=purchase). These results are piped into the stats command and the dc(), or distinct_count() function is used to count the number of different users who make purchases. The BY clause is used to break up this number based on the different categories of products (category).


This example contains a subsearch as an argument for the append command.

 …[search sourcetype=access_* action=purchase | top 1 clientip BY categoryId]


The subsearch is used to search for purchase-related events and counts the top purchaser (based on clientip) for each product category. These results are added to the results of the previous search using the append command.


The table command is used to display only the category of products (categoryId), the distinct count of users who purchased each type of product (dc(clientip)), the actual user who purchased the most of a product type (clientip) and the number of each product that user purchased (count).


Example-2:

Show the count of distinct internal vendors (VendorID<2000) and count of distinct external vendors (VendorID>=2000) with all the Product Code.


The output should be formatted as listed below:

       Code      Internal Vendors      External Vendors

        A              5                              4

        B              1                              3


index=test sourcetype=vendor_sales | where VendorID>=2000 | stats dc(VendorID) as External_Vendors by Code | append [| search index=”sessi” sourcetype=”vendor_sales” | where VendorID<2000 | stats dc(VendorID) as Internal_Vendors by Code] | stats first(*) as * by Code


Appendpipe

The appendpipe command adds the result of the subpipeline to the search results. 

Unlike a subsearch, the subpipeline is not run first – it is run when the search reaches the appendpipe command.

The appendpipe command can be useful because it provides a summary, total, or otherwise descriptive row of the entire dataset when you are constructing a table or chart. This command is also useful when you need the original results for additional calculations.

Example:

Reference Appendpipe command

Map

The map command is a looping operator that runs a search repeatedly for each input event or result. You can run the map command on a saved search or an ad hoc search but cannot use the map command after an append or appendpipe command in your search pipeline.

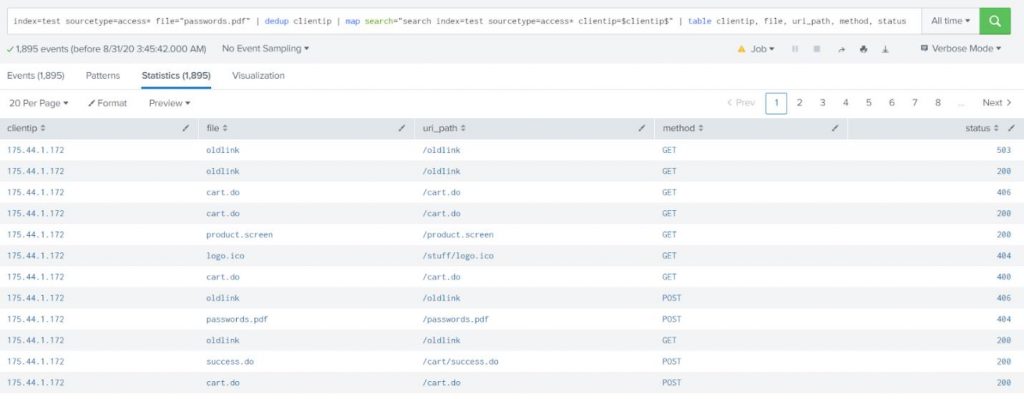
Example:

Show the web activity for all IP addresses which have tried accessing the file “passwords.pdf.”

index=test sourcetype=access* file=”passwords.pdf” | dedup clientip | map search=”search index=test sourcetype=access* clientip=$clientip$” | table clientip, file, uri_path, method, status

Explanation:

The $clientip$ is a token within the search of map command. It will be replaced with the value of clientip field from the result of the first search. So, the search for map command will be executed as many times as the number of results from the first search.

More useful commands

  • Predict
  • Addinfo (Not explained in the post, Reference)
  • Set
  • Iplocation
  • Geostats

Predict

The predict command forecasts values for one or more sets of time-series data. Additionally, the predict command can fill in missing data in a time-series and can also provide predictions for the next several time steps.

The predict command provides confidence intervals for all its estimates. The command adds a predicted value and an upper and lower 95th percentile range to each event in the time-series.

How the predict command works:

  • The predict command models the data by stipulating that there is an unobserved entity that progresses through time in different states.
  • To predict a value, the command calculates the best estimate of the state by considering all the data in the past. To compute estimates of the states, the command hypothesizes that the states follow specific linear equations with Gaussian noise components.
  • Under this hypothesis, the least-squares estimate of the states is calculated efficiently. This calculation is called the Kalman filter or Kalman-Bucy filter. A confidence interval is obtained for each state estimate. The estimate is not a point estimate but a range of values that contain either the observed or predicted values.

Example:

Predict future access based on the previous access numbers that are stored in Apache web access log files. Count the number of access attempts using a span of one day.

index=test sourcetype=access* | timechart span=1d count(file) as count | predict count

The results appear on the Statistics tab. Click the Visualization tab. If necessary, change the chart type to a Line Chart.

As of machine learning concepts, the more the data the better the prediction. So, if you have data for a longer period of time, then you will have a better prediction. 

Set

The set command performs set operations on subsearches.

  • Union – Returns a set that combines the results generated by the two subsearches. Provides results that are common to both subsets only once.
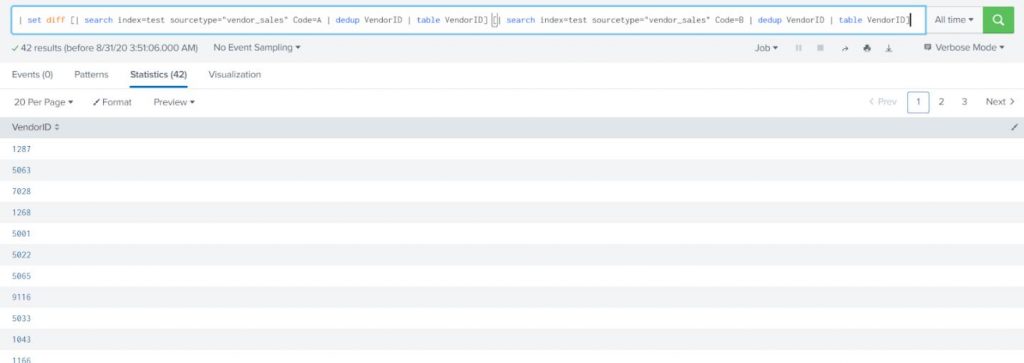
  • Diff – Returns a set that combines the results generated by the two subsearches and excludes the events common to both. Does not indicate which subsearch the results originated from.
  • Intersect – Returns a set that contains results common to both subsearches.

Example:

Find all the distinct vendors who purchase item A (Code=A) but not item B.

| set diff [| search index=test sourcetype=”vendor_sales” Code=A | dedup VendorID | table VendorID] [| search index=test sourcetype=”vendor_sales” Code=B | dedup VendorID | table VendorID]

Iplocation

Iplocation extracts location information from IP addresses by using 3rd-party databases. This command supports IPv4 and IPv6.

The IP address that you specify in the ip-address-fieldname argument is looked up in the database. Fields from that database that contain location information are added to each event. The setting used for the allfields argument determines which fields are added to the events.

Since all the information might not be available for each IP address, an event can have empty field values.

For IP addresses that do not have a location, such as internal addresses, no fields are added.

Example-1:

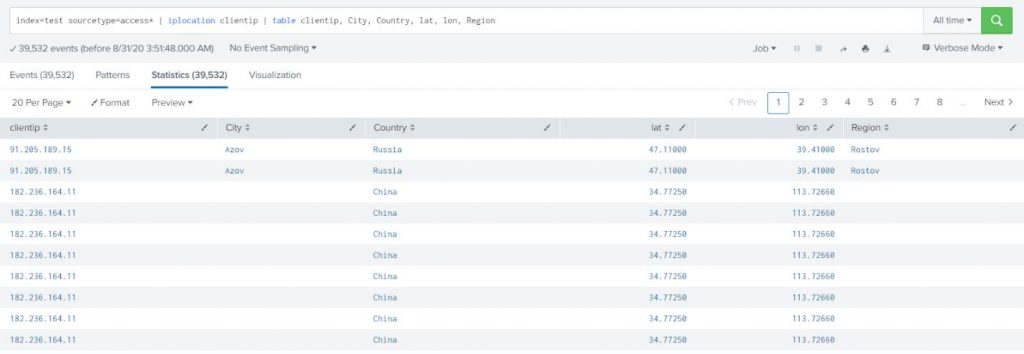
Add location information to web access events. By default, the iplocation command adds the City, Country, lat, lon, and Region fields to the results.

index=test sourcetype=access* | iplocation clientip | table clientip, City, Country, lat, lon, Region

Example-2:

Search for client errors in web access events, returning only the first 20 results. Add location information and return a table with the IP address, City, and Country for each client error.

index=test sourcetype=access* status>=400 | head 20 | iplocation clientip | table clientip, status, City, Country


We usually use the iplocation command to get the geolocation and the best way to visualize the geolocation is Map. In that case the geostats command can be used.

Geostats

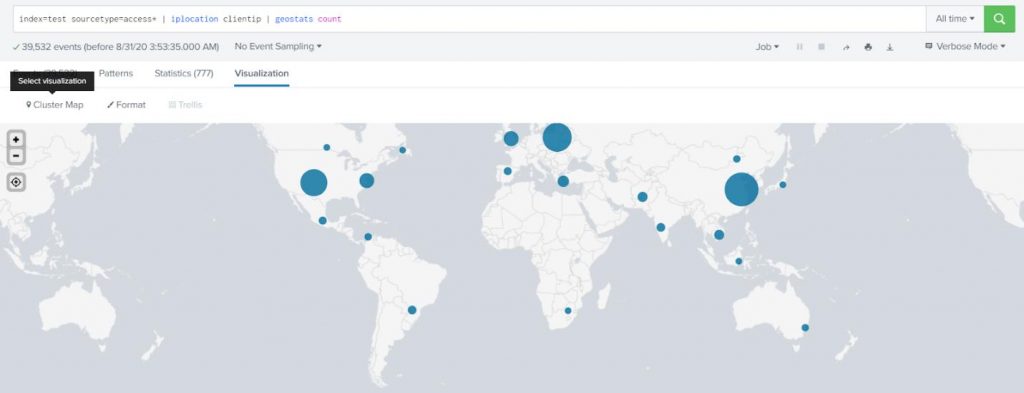
The fun part is that once you get the geo-location with the iplocation command, you can put the results on a map for a perfect visualization.


The geostats command works in the same fashion as the stats command.


Example:

Show the number of requests coming in by different geographical locations on the map (use sourcetype=access*).


index=test sourcetype=access* | iplocation clientip | geostats count

Choose a Cluster Map for visualization.


Written by Usama Houlila.

Any questions, comments, or feedback are appreciated! Leave a comment or send me an email to uhoulila@newtheme.jlizardo.com for any questions you might have. Happy Splunking 🙂

ABC’s of Splunk Part Seven: Basics of Search

Aug 26, 2020 by Sam Taylor

Now that you have some knowledge from our previous blogs, you are now ready to start your journey to become a Splunk Ninja!

For the next six blogs, we are going to focus on Search starting from the basics and moving into advanced correlation and detection. Let’s begin…

Splunk uses Search Processing Language, commonly known as SPL. Which is very similar to SQL or Database query language and your ability as a Splunk administrator to conduct complex searches allows you to extract the maximum value out of your Splunk investment

Prerequisites

Since every installation is different based on the environment that it’s collecting data from, I’m opting to create a standard template for the data acquisition so that the reader can walk through this blog with as little confusion as possible.  Please feel free to experiment with your actual data as you see fit and if something doesn’t work, ping me and I should be able to respond to you within 24 hours.


Splunk Installation – You must have Splunk Enterprise installed in your environment. Follow the Splunk Installation Blog to install Splunk Enterprise. 

Data Onboarding – For this blog, we’ll be using data from the top command 


Follow below steps to collect the data. This will help you follow the blog along and perform the searches on your own.

1. Open Splunk Web UI.

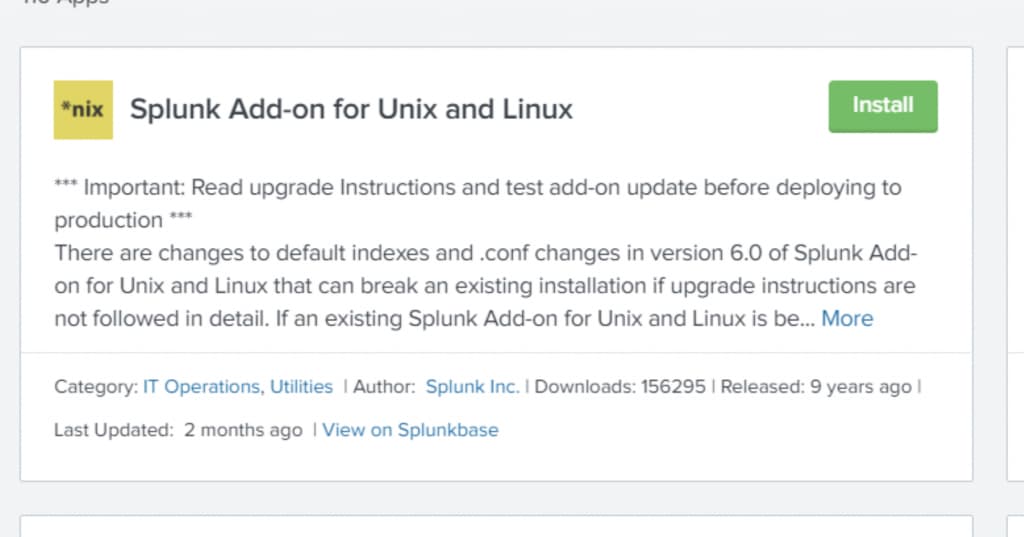
2. Install Unix and Linux Add-on for Splunk.

    • Go to Manage Apps. (Settings button on Splunk Home page)
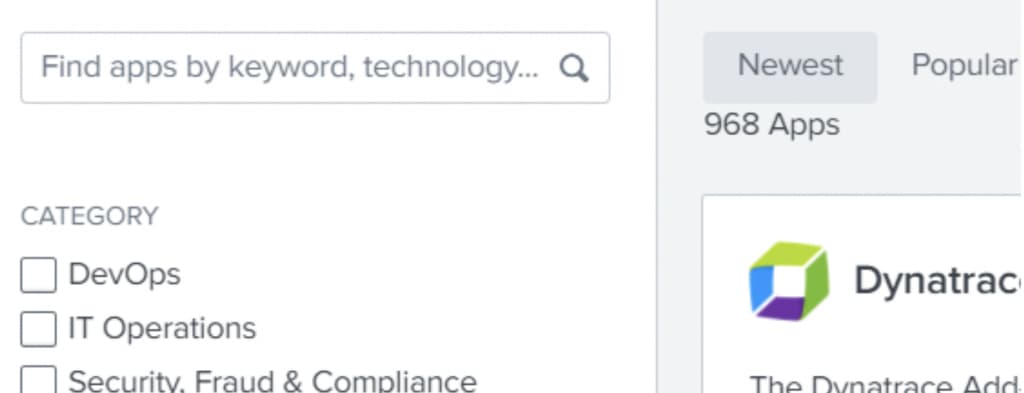
    • Click on Browse more Apps.
    • Search for ”Unix and Linux“
    • Click on Install, on the “Splunk Add-on for Unix and Linux”.

3. Enable the input to collect the data.

    • Once the Add-on is installed, click on Open App.
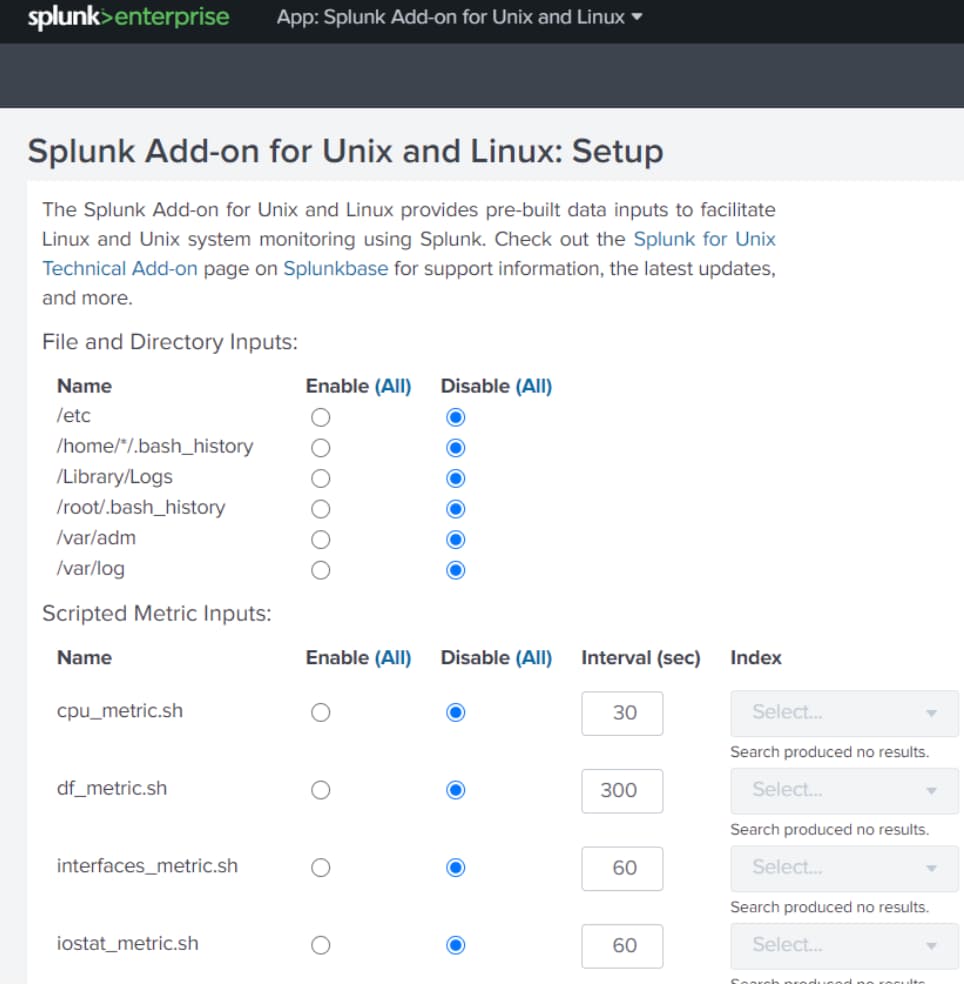
    • Click on Continue to app setup page.
    • You will see a page like this.
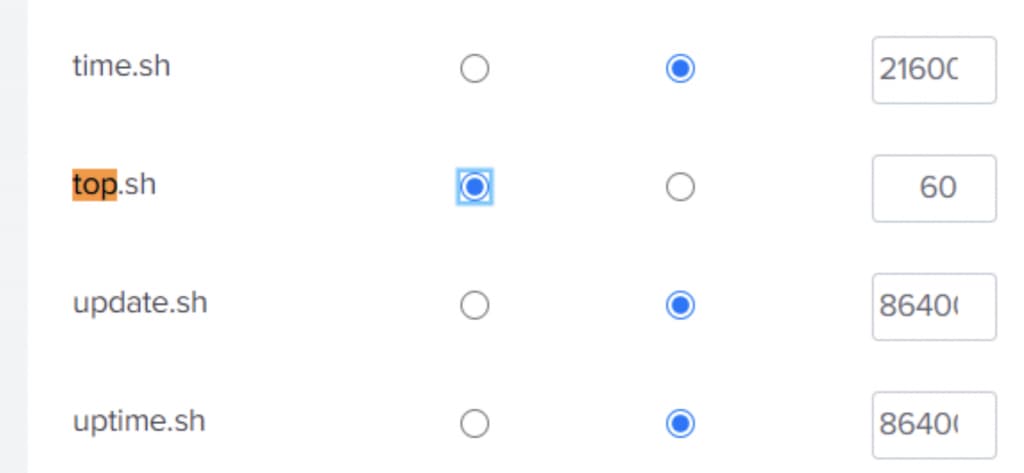
    • Find for “top” on the page and Enable the Input.
    • Click on Save.

4. Change the index to os. 

    • Login (ssh) to the backend of the Splunk machine.

    • Open inputs.conf in the editor.
    • Search for top.

    • Add the below line in the stanza.

      • index = os

    • Your final stanza would look like:

    • Save the file.

    • Restart Splunk.

Let’s Start Splunking

Login to Splunk Web UI.

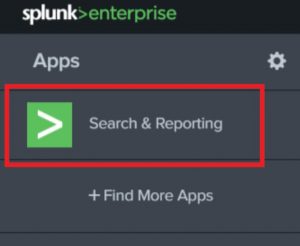
You will see a list of App on the left sidebar when you login. Open the Search & Reporting App.

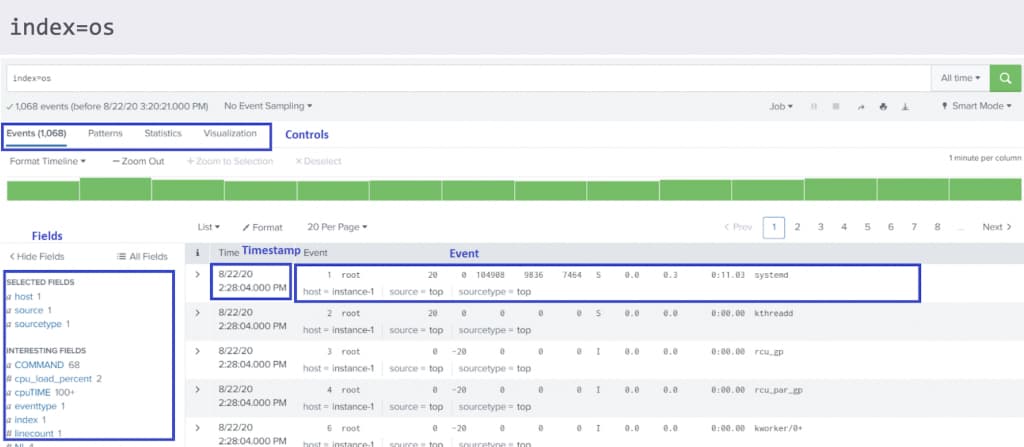
Let’s understand the main search part.


Search Bar – Where you will be writing SPL queries.

Time Range Picker – Each event (log) in Splunk has a timestamp, you can limit the time of your search with timerange picker.

Add below search in the search bar and hit enter.

index=os

Controls – Gives the option to choose “how to show the search results.”

  • Events – Shows Events

  • Statistics – Shows results in a table(statistics) format. (We’ll get more idea later in this blog)

  • Visualization – Shows results in charts (visualization). (We’ll get more idea later in this blog)

Events Tab

Fields – Show fields present in all the events as part of the results of your search.

Event – one of the events of the results. An Event is a log collected earlier in the Splunk as part of the data onboarding process.

Timestamp – Timestamp of an event in Splunk. It usually represents the time of an event on the source.

Commands

SPL (Search query) uses commands to format results in different formats. The purpose of a command could be to format the result, to evaluate some value based on other values, to summarize the results or anything else. 

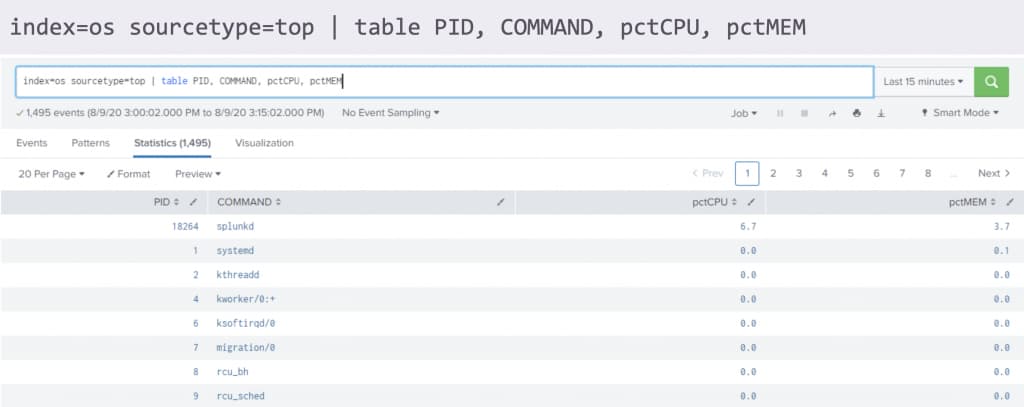
We’ll learn a few basic and very useful commands in this blog. Let’s understand commands by first command “table”.

Command – table and Statistics Tab

The command table is the formatting command and shows how fields should be displayed in a table format.


Notice that the results, in this case, are shown in the Statistics tab in a tabular form.

Now, let’s understand some more highly used commands.

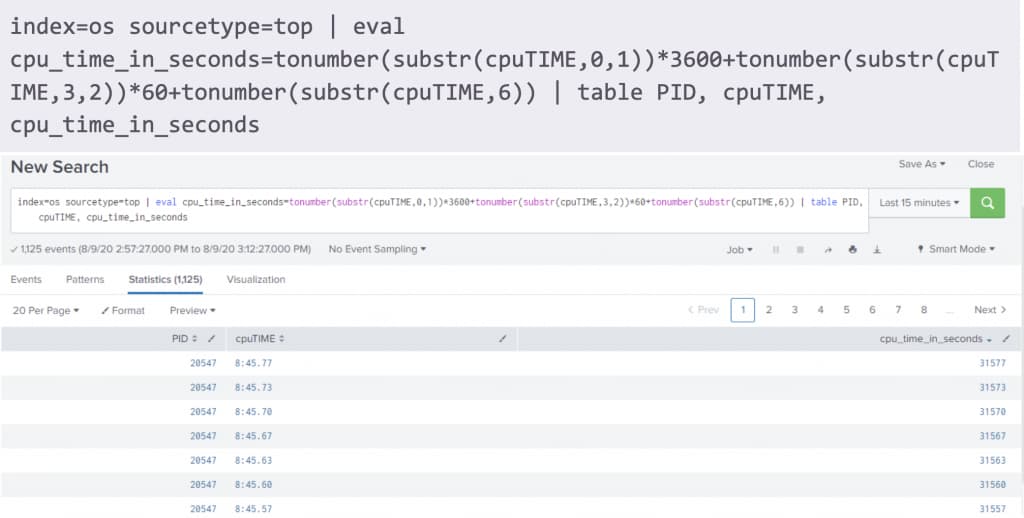
Command – eval

To evaluate some function on any field(s)


Command – stats

To transform the results to get some useful statistics


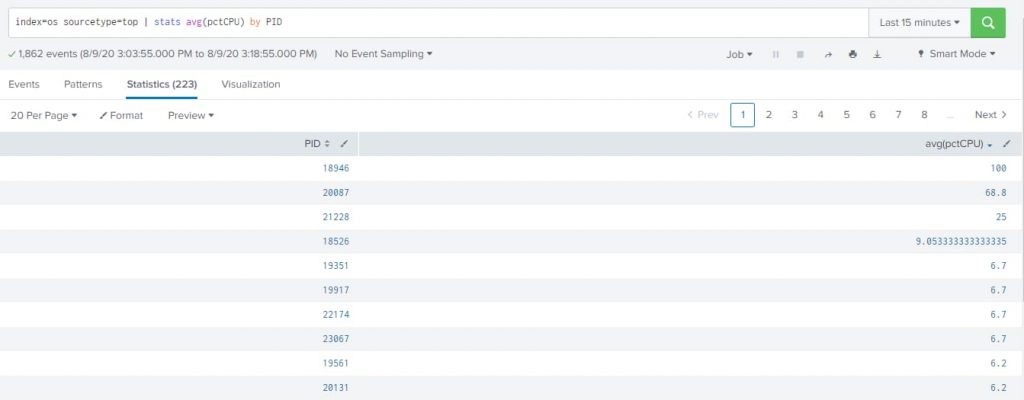
index=os sourcetype=top | stats avg(pctCPU) by PID


This query will give average CPU usage by different processes in the system.


Command – timechart and Visualization Tab

Like stats, timechart also transforms the results in the statistics, but timechart can provides statistics with regards to time.


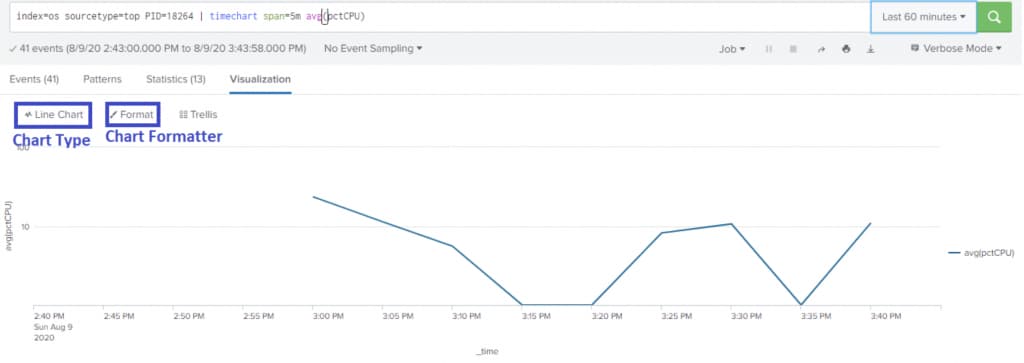
index=os sourcetype=top PID=18264 | timechart span=5m avg(pctCPU)


This query also give average CPU usage by different processes in the system, but with timechart it shows an average CPU usage per 5 minutes over time.

The span parameter in the command is optional.


The results will be shown to you on the Statistics tab. Just change to Visualization tab to see a line chart like below.


Chart Type – If you don’t see a line chart and see some other chart, then you can change the chart with this option.

  • Line Chart

  • Area Chart

  • Bar Chart

  • Column Chart

  • Bubble Chart

  • Map

  • Pie Chart

  • Single Value

  • Etc.


Chart Formatter – This will provide you various options related to the selected chart type.

     For example, 

  • For the line chart, it allows selecting an option for what to choose when the value isn’t available. Like, show null or show zero or connect previous and next values with a line. (Reference)

  • For the column chart and bar chart, it allows you to choose stack mode. (Reference)

Command – where

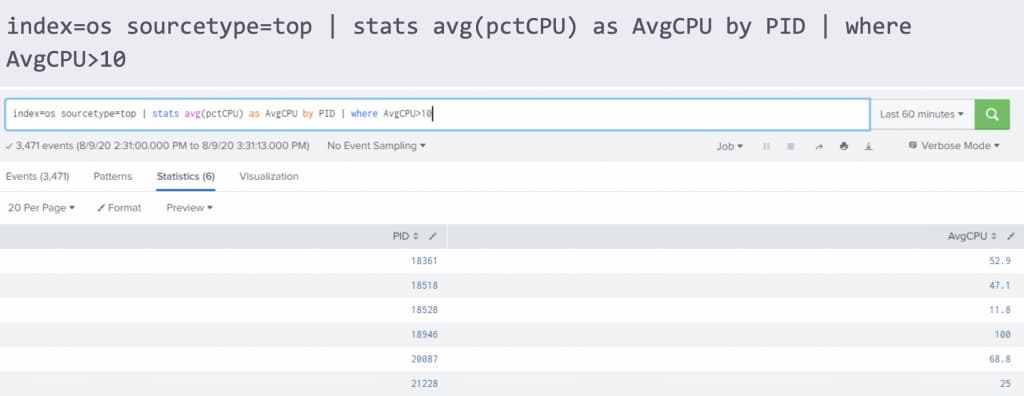
To filter the results based on the condition. Unlike the search command, where command also allows to use >, <, signs.

index=os sourcetype=top | stats avg(pctCPU) as AvgCPU by PID | where AvgCPU>10


Command – rename

To rename the fields

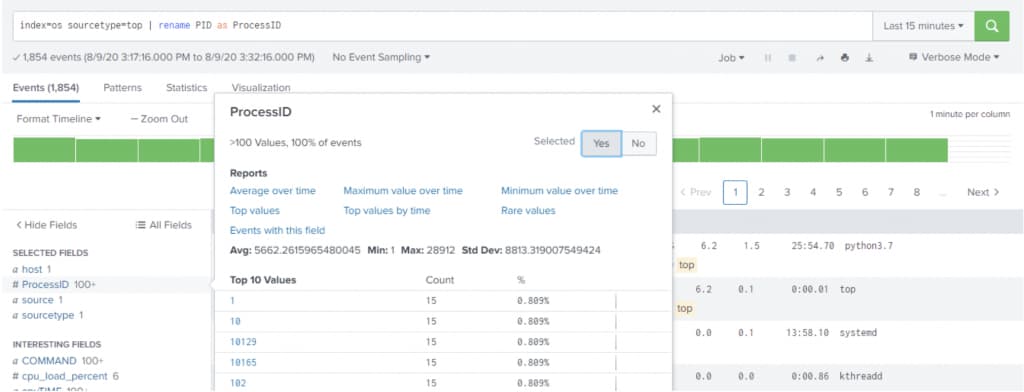
index=os sourcetype=top | rename PID as ProcessID


Above command renames the “PID” field with the new name “ProcessID”

Unlike the eval command, which generates the new field.


Command – sort

To sort the results based on some field values.

index=os sourcetype=top | stats avg(pctCPU) as AvgCPU by PID | sort – AvgCPU


  • sort – <fieldname> – Indicate the descending order sorting

  • sort + <fieldname> – Indicate the ascending order sorting


Command – dedup

To get only first events based on the value of any field(s)

index=os sourcetype=top | dedup PID


You can have multiple fields with PID.  When you put multiple fields with dedup, it will keep events where there are unique combinations of these field values.

Now when you know basic search commands of Splunk, play around the search by your self. Search the other data available in your environment.

You can find all the search command available with Splunk here – http://docs.splunk.com/Documentation/Splunk/6.5.2/SearchReference/Commandsbycategory

Play around using different charts. You can get more information about each different types of the charts here – https://docs.splunk.com/Documentation/Splunk/8.0.5/Viz/Visualizationreference

Written by Usama Houlila.

Any questions, comments, or feedback are appreciated! Leave a comment or send me an email to uhoulila@newtheme.jlizardo.com for any questions you might have.
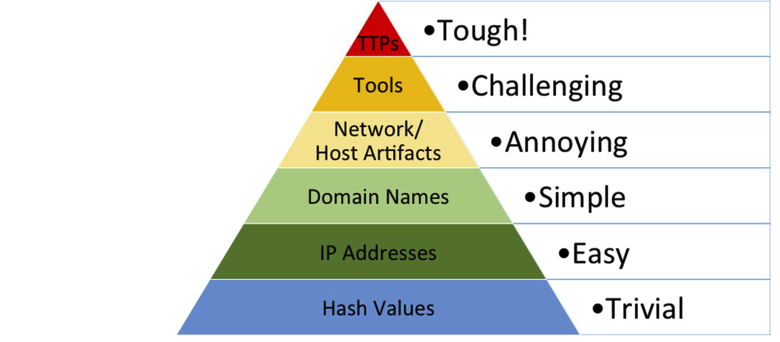
ABC’s of Splunk Part Six: Distributed-Clustered Architecture Splunk Installation

Aug 18, 2020 by Sam Taylor

I started receiving messages from Reddit and LinkedIn regarding the proper buildout of a clustered environment, so for this blog, I will go over the different components and details required to properly build a clustered Splunk environment.

In my previous blogs, you can read about what kind of environment to build. If you chose a single environment then blogs 2 and 3 are for you. However, if you chose to build a clustered environment, then this blog will walk you through the entire process.

Prerequisite Blog- Splunk – How to install Splunk (Standalone)

For this blog, we are configuring the following components:

  • 1 Cluster Master

  • 3 Indexers

  • 1 Search Head

  • 1 License Master

  • 1 DMC (Distributed Monitoring Console)

Cluster Master

  1. Install Splunk.

  2. Go to Splunk Web.

  3. Settings > Indexer Clustering.

  4. Select Enable indexer clustering.

  5. Select the Master Node and click Next.

  6. There are a few fields to fill out:

    1. Replication Factor – The Replication Factor determines how many copies of data the cluster maintains. The default is 3.

    2. Search Factor – The Search Factor determines how many immediately searchable copies of data the cluster maintains. The default is 2.

    3. Security Key – Security Key is the key that authenticates communication between the master, the peers and the search heads. The key must be the same across all cluster nodes. The value that you set here on the master must be the same that you subsequently set on the peers and search heads as well.

    4. Cluster Label – You can label the cluster here. The label is useful for identifying the cluster in the monitoring console. See Set Cluster Labels in Monitoring Splunk Enterprise.

  7. Click Enable Master Node.

  8. Restart Splunk.

Reference

Indexers

  1. Install Splunk.

  2. Go to Splunk Web.

  3. Settings > Indexer Clustering.

  4. Select Enable Indexer Clustering.

  5. Select the Peer Node and click Next.

  6. There are a few fields to fill out:

    1. Master URI – https://:8089

    2. Peer Replication Port – This is the port on which the peer receives replicated data streamed from the other peers.

    3. Security key – Security Key is the key that you specified while configuring the Master Node.

  7. Click Enable peer node.

  8. Restart Splunk.

 Reference

More Actions on Cluster Master

Push Bundles/Apps

You should not push any Apps individually onto an indexer. Instead, install and configure the Apps on the cluster master node and then push the changes to all the indexers. The following is the common configuration space on the master node-ster-

How to push the configuration changes to the indexers:

  1. Go to Master node UI.

  2. Go to Settings > Indexer Clustering.

  3. Click Edit > Configuration Bundle Actions.

  4. (Optional) Click Validate and Check Restart > Validate and Check Restart.

    1. It is recommended to validate the bundle before pushing it to the indexers.

  5. Click Push.

  6. Click Push Changes.

Where to find the configuration on the individual indexers?

Indexes.conf

One thing that you will end up running into is the fact that over time, you will need to remove and add many indexes in your environment and to manage and edit those within each App is daunting. Instead, I recommended having an app called master_indexes (You can have any other name) and put an indexes.conf file in the local directory of this App and place all the indexes definitions in this file. Please note, if you enabled replication (see below)

add the following line to each index “ repFactor = auto” in all the stanzas of indexes.conf to tell Splunk to replicate the index across the cluster.

License Master

  1. Follow all the steps of making a Splunk Instance as Search head including forwarding data to the indexers. See the section above- Search Head

  2. Install Licence

    1. Go to  Settings > Licensing.

    2. Click Add License.

    3. Click Choose File. Browse for your license file and select it.

    4. Click Install.

Reference

Make All Other Nodes As Slave Nodes

Follow the steps below on all the other instances in the cluster including the Master Node.

  1. Navigate to Settings > Licensing.

  2. Click Change to Slave.
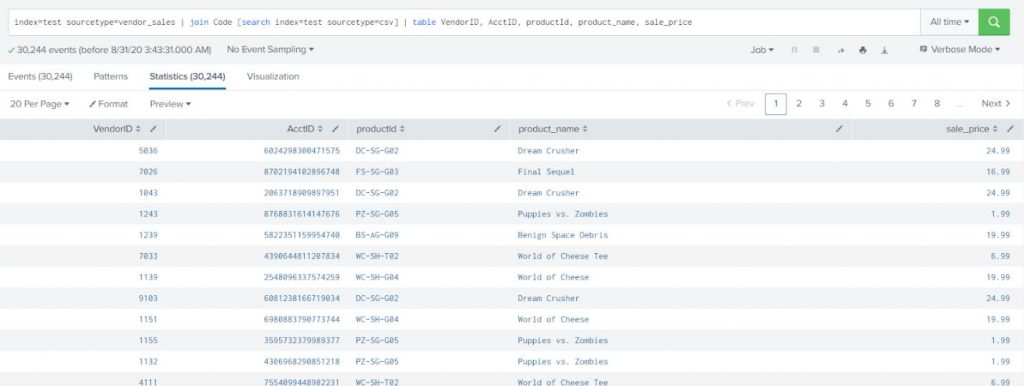
  3. Switch the radio button from Designate this Splunk instance as the Master License Server to designate a different Splunk instance as the Master License Server.

  4. Specify the License Master to which this License Slave should report. You must provide either an IP address or a hostname, as well as the Splunk management port, which is 8089 by default.

  5. Click Save.
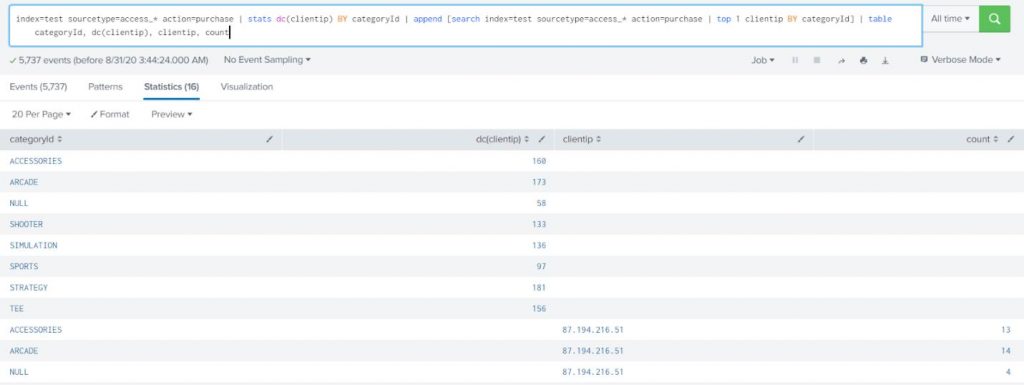
  6. Restart Splunk Enterprise.
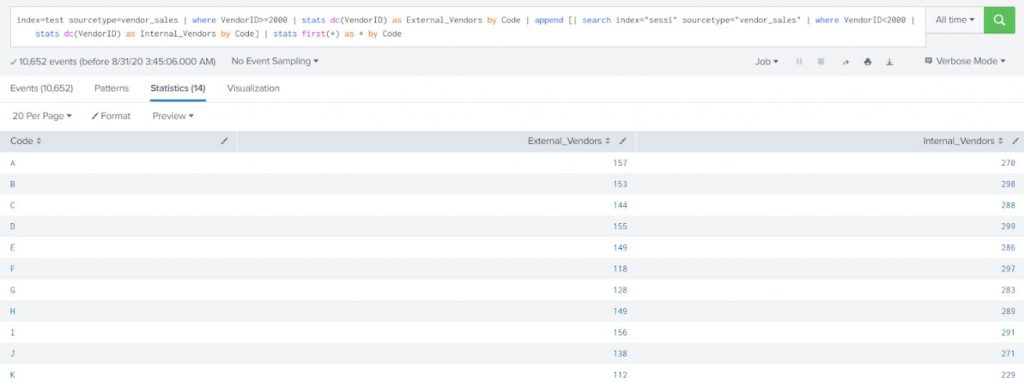
Reference 

Search Head

  1. Install Splunk.
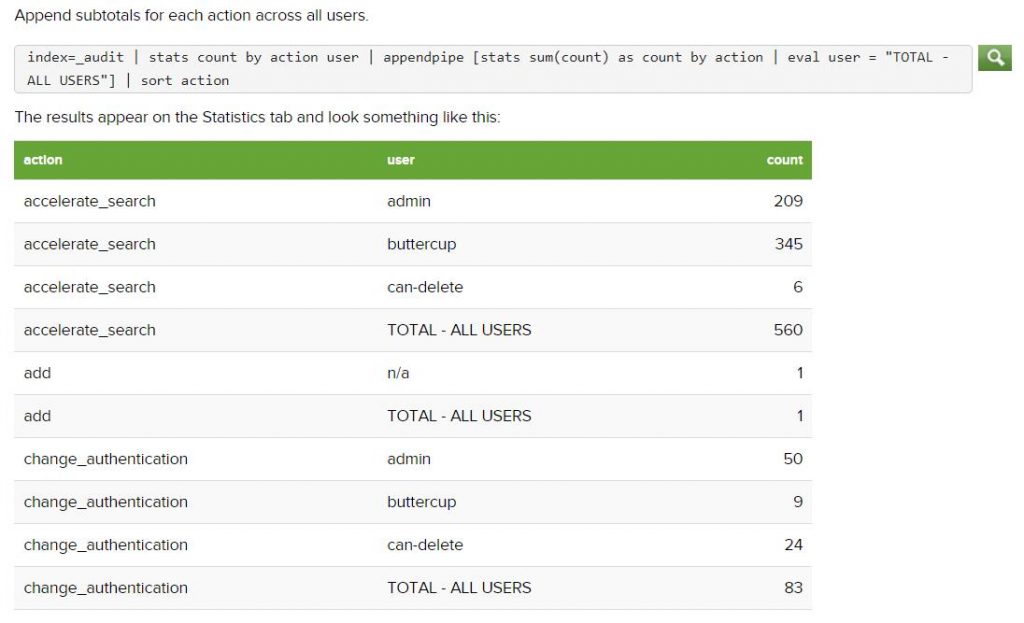
  2. Go to Splunk Web.

  3. Settings > Indexer Clustering.

  4. Select Enable Indexer Clustering.

  5. Select the Search Head Node and click Next.

  6. There are a few fields to fill out:

    1. Master URI – https://:8089

    2. Security key – Security Key is the key that you specified while configuring the Master Node.

  7. Click Enable Search Head Node.

  8. Restart Splunk.

Reference

DMC (Distributed Monitoring Console)

Installation

  • Follow all the steps of making a Splunk Instance as Search head. See the section above: Search Head

Add All The Instances In A Distributed Search

  1. Navigate to Settings > Distributed search > Search peers.

  2. Click New.

  3. Fill in the requested fields (see below and click Save)

  1. Repeat steps 3 and 4 for each search head, deployment server, license master, and cluster master.

Reference

Enable DMC

  1. Navigate to Settings > Monitoring Console.

  2. Go to Settings > General Setup.

  3. Click Distributed Mode.

  4. Confirm the following:

    1. The columns labeled instance and machine are populated correctly and show unique values within each column.

    2. The server roles are correct. For example, a Search Head that is also a Licensed Master must have both server roles listed. If not, click Edit > Edit Server Roles and select the correct server roles for the instance.

    3. Make sure the cluster master instance is set to the cluster master server role. If not, click Edit > Edit Server Roles and select the correct server role.

    4. Make sure anything marked as an indexer is actually an indexer.

  5. Click Apply Changes.

Reference

Notes

  • You can add the DMC and or License Master to any machine that is not under a heavy usage load.

  • Do not enable any other management tasks on the Cluster Master Node as it has the heavy load of managing the cluster.

Final Note:

Sometimes in a clustered environment, the search head is used to collect data from a cloud tenancy (through an App or TA), however, that data will not make its way to the indexers which will make it unsearchable by other search heads. The correct way to address that is by forwarding any data the search head collects to the Indexers.

Forward Data to Indexers

  1. Create an outputs.conf file in the

  2. Put the below content in the file.

# Turn off indexing on the node

[indexAndForward]

index = false

[tcpout]

defaultGroup = my_peers_nodes

forwardedindex.filter.disable = true

indexAndForward = false

[tcpout:my_peers_nodes]

server=10.10.10.1:9997,10.10.10.2:9997,10.10.10.3:9997

Here, replace IP addresses with the IP addresses of Indexers.

Reference

Written by Usama Houlila.

Any questions, comments, or feedback are appreciated! Leave a comment or send me an email to uhoulila@newtheme.jlizardo.com for any questions you might have.