Protecting your Windows Environment from Kernel-mode Malware
As we were looking to better protect the Windows environments from Ransomware, we quickly realized that very few security technologies have visibility into kernel-mode malware behavior. This type of malware has equal or even higher privileges than most security tools. Thus, attackers can essentially take safe refuge in the kernel, acting on nefarious intentions with little concern for getting caught. In looking at our options, we decided to go with System Monitor for many reasons to follow.
Sysmon is a Windows system service and device driver that can assist you in detecting advanced threats on your network by providing intricate host-operation details in real time. It provides detailed information about process creations, network connections and changes to file creation time. Most importantly, Sysmon can capture the more sophisticated kernel-mode malware. The list below published by Microsoft provides the details we were most interested in.
- Logs process creation with full command line for both current and parent processes.
- Records the hash of process image files using SHA1 (the default), MD5, SHA256 or IMPHASH.
- Includes a process GUID in process to create events that allow for correlation of events, even when Windows reuses process IDs.
- Includes a session GUID in each event to allow correlation of events on the same logon session.
- Logs loading of drivers or DLLs with their signatures and hashes.
- Logs opens for raw read access of disks and volumes.
- Optionally logs network connections, including each connection’s source process, IP addresses, port numbers, host names and port names.
- Detects changes in file creation time to understand when a file was really created. Modification of file create timestamps is a technique commonly used by malware to cover its tracks.
- Automatically reloads configuration if changed in the registry.
- Generates events from early in the boot process to capture activity made by even sophisticated kernel-mode malware.
Important Note: When we activated Sysmon on a live environment, the amount of Index usage exceeded 2GB a day; however, we have added the necessary filters here to reduce it to somewhere around ten thousand to one hundred thousand logs a day which will take an extremely small bite out of your license.
- This method will require Splunk Universal Forwarder or Splunk Heavy Forwarder to be installed and running on the Windows server.
- Data Forwarding is configured from the Forwarder to Splunk Indexers.
- Download Sysmon Archive from here.
- Extract the binary to your preferred location.
- Download the file to the Directory where you have extracted from Sysmon.
- Run Windows CMD or PowerShell in the Administrator mode.
- Change the Sysmon config file.
- In the Sysmon config file, the FileCreate section removes the extensions rule and adds a rule to include all the files from Sysmon based on drive letters. sysmon.exe -accepteula -i sysmonconfig-export.xml
- Or take reference for Sysmon config file from here.
- After successfully configuring the Sysmon service, install the Splunk Add-on for Sysmon on your UF or HFW. Download the app from here.
- Navigate to the $SPLUNK_HOME/etc/apps/TA-microsoft-sysmon/local. (Create a local directory if it doesn’t exist.)
- Create a file named inputs.conf with the content below.
- Restart Splunk on the Forwarder.
Verify the Data Being Ingested
Run the below search-query on the search head:
Data Reduction
By default, if you collect all the Sysmon data it will generate a huge amount of data as you will be collecting it from all the Windows hosts in your environment. This will consume licensing, too. Though Sysmon provides a lot of data, you likely don’t need most of it so you can filter the data to reduce the number of events coming in, which saves you Splunk licensing and storage.
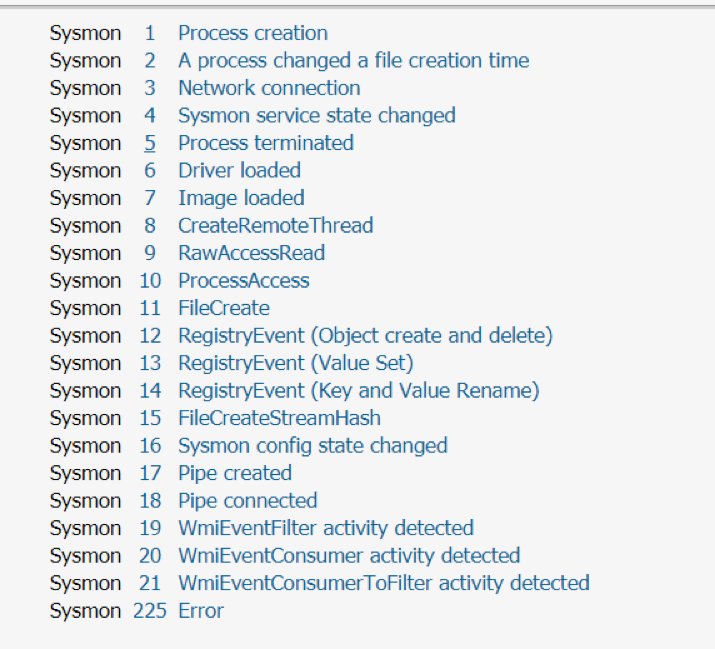
A list of EventIDs Sysmon generates:

For this example, we only need EventCodes 1, 2, 5 and 11.
Updated stanza to achieve this filtering add (whitelist = 1,2,5,11) parameter in the Sysmon input stanza.
disabled = false
renderXml = 1
index = epintel
whitelist = 1,2,5,11
# Whitelisting only – Process creation(1), Process changed file creation time(2), Process terminated(5), FileCreated(11)
References
Ransomware Part-2 (More Use-Cases)
In case you haven’t installed the dependencies in your environment (Search Head), please look to the following:
- Enterprise Security (optional)
- People use correlation searches in ES for security incidents, but you can simply create an alert without having ES. Queries here use some macros built-in with ES.
- Splunk Common Information Model (CIM)
- It’s an App that we would need for some of the searches as those are based on CIM data models.
- ES Content Update App
- It’s a Splunk App that brings all these use-cases of Ransomware based on the MITRE framework.
- Queries here use some macros that come built-in with ES
USN journal deletion
The fsutil.exe application is a Windows utility used to perform tasks related to the file allocation table (FAT) and NTFS file systems. The update sequence number (USN) change journal provides a log of all changes made to the files on the disk. This search looks for fsutil.exe deleting the USN journal.
Data Collection/
The data from Sysmon Operational Logs can be used to collect the processes data. Use Sysmon Add-on for Splunk for the data collection and field extraction.
Detection
Reference – From ES Content Update App – ESCU – USN Journal Deletion – Rule
Explanation
- This detection query is based on the Processes dataset from the Endpoint data model.
- The search will try to identify the “fsutil.exe” process and see if it is deleting the journal files.
- This is only for Windows machines.
Fake Windows processes
Windows processes are normally run from Windows\System32 or Windows\SysWOW64. This search will try to find if there is a Window process running from some other location. This can indicate a malicious process trying to hide as a legitimate process.
Data Collection
We can use two options for data collection:
- Sysmon Operational Logs
- Sysmon Add-on for Splunk can be used to collect this data.
- We’ll be using EventCode 1 from this data.
- Windows Security Logs
- Splunk Add-on for Windows can be used to collect this data.
- To enable the collection on the host you must enable the auditing on the server. Follow Microsoft – Audit Process Tracking to enable the process tracking.
- We’ll be using Event ID 4688 from this data.
- Sysmon Operational Logs
Detection
Reference – From Splunk Security Essentials App – Fake Windows Processes
| tstats `security_content_summariesonly` count values(Processes.process) as process values(Processes.parent_process) as parent_process min(_time) as firstTime max(_time) as lastTime from datamodel=Endpoint.Processes where Processes.process_name=fsutil.exe by Processes.user Processes.process_name Processes.parent_process_name Processes.dest | `drop_dm_object_name(Processes)` | `security_content_ctime(firstTime)`| `security_content_ctime(lastTime)` | search process=”*deletejournal*” AND process=”*usn*” | `usn_journal_deletion_filter`
Explanation
- This detection query is based on the Processes dataset from the Endpoint data model.
- The query is using a lookup named isWindowsSystemFile_lookup from the Security Essential App. The lookup determines whether the process is a Windows system file or not.
Scheduled tasks used in Bad Rabbit ransomware – Rule
This search looks for flags passed to schtasks.exe on the command-line that indicate that task names related to the execution of Bad Rabbit ransomware were created or deleted.
Data Collection
The data from Sysmon Operational Logs can be used to collect the processes data. Use Sysmon Add-on for Splunk for the data collection and field extraction.
Detection
Reference – From ES Content Update App – ESCU – Scheduled tasks used in Bad Rabbit ransomware – Rule
| tstats `security_content_summariesonly` count values(Processes.process) as process values(Processes.parent_process) as parent_process min(_time) as firstTime max(_time) as lastTime from datamodel=Endpoint.Processes where Processes.process_name=fsutil.exe by Processes.user Processes.process_name Processes.parent_process_name Processes.dest | `drop_dm_object_name(Processes)` | `security_content_ctime(firstTime)`| `security_content_ctime(lastTime)` | search process=”*deletejournal*” AND process=”*usn*” | `usn_journal_deletion_filter`
Explanation
- This detection query is based on the Processes dataset from the Endpoint data model.
- The query will try to search for the process name schtasks.exe from the data.
- If the process is trying to search for the following keywords rhaegal, drogon or viserion_ that means there is presence of Ransomware in the environment
Macros
What are macros?
Search macros are reusable chunks of Search Processing Language (SPL) that you can insert into other searches. Search macros can be any part of a search, such as an eval statement or search term, and do not need to be a complete command. You can also specify whether the macro field takes any arguments.
How to find/update the macro definition
- Select Settings > Advanced Search > Search macros.
- Check that the App you are looking at is correct. If you don’t know the App, just select All.
- Type the macro name in the text filter and hit enter. That way you will be able to find the macro.

- Click on macro from the list.
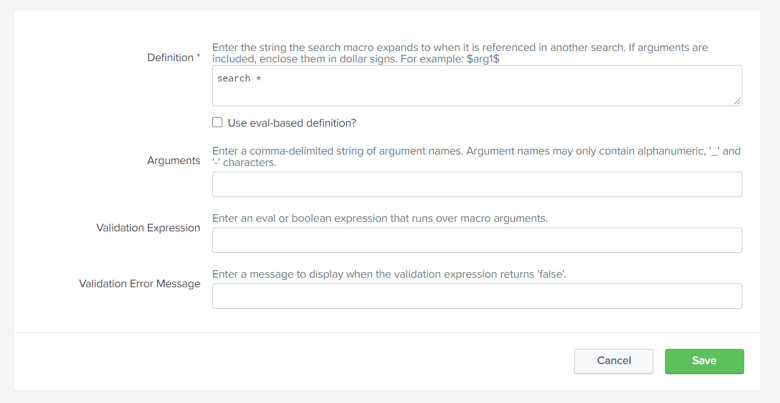
- Edit/View the definition of macro in the opened Window.

- Click Save to save your search macro.
Macro Definitions
Here are some of the macros that are being used in above examples:
- `security_content_summariesonly`
- Definition – summaryonly=false
- Use summaryonly=true in case you have the data-models accelerated.
- `drop_dm_object_name(Filesystem)`
- Definition – rename FileSystem.* as *
- `security_content_ctime(firstTime)`
- Definition – convert timeformat=”%Y-%m-%dT%H:%M:%S” ctime(firstTime)
- `security_content_ctime(lastTime)`
- Definition – convert timeformat=”%Y-%m-%dT%H:%M:%S” ctime(lastTime)
- `tor_traffic_filter`
- Definition – search *
- Update this macro definition in case you want to whitelist any traffic.
- `usn_journal_deletion_filter`
- Definition – search *
- Update this macro definition in case you want to whitelist any events.
- `system_processes_run_from_unexpected_locations_filter`
- Definition – search *
- Update this macro definition in case you want to whitelist any events.
- `scheduled_tasks_used_in_badrabbit_ransomware_filter`
- Definition – search *
- Update this macro definition in case you want to whitelist any events.
This concludes our searches for this post. The macros definitions above are used in case you don’t have Enterprise Security licensing.
Happy Splunking!
Written by Usama Houlila.
Any questions, comments, or feedback are appreciated! Leave a comment or send me an email to uhoulila@newtheme.jlizardo.com for any questions you might have.