
For this blog, we are going to go over how to ingest our windows environment and Active Directory logs and how to set up advanced search commands to continue with our efforts to reduce our attack surface area. This issue has gained importance since last week after the discovery of a new set of exploits that Microsoft cannot seem to be able to patch in time and instead is installing workarounds. Splunk is a great tool in these scenarios because you can create real-time alerts that would discover and mitigate automatically all the time.
How to collect the data
Splunk Add-on for Windows will allow you to collect all the data related to Active Directory and Windows Event Logs.
Download from Splunkbase | Documentation
The data it collects
- Performance Data (CPU, I/O, Memory, etc.)
- Windows Event log
- Active Directory and Domain Name Server debug logs from Windows hosts that act as domain controllers.
Please note: you must configure the Active Directory audit policy since Active Directory does not log certain events by default. - Domain Name Server debug logs from Windows hosts that run a Windows DNS Server. Please note: Windows DNS Server does not log certain events by default so you must enable debug logging.
Note – If you don’t know what Windows Event Logging is and what data it can provide, please refer to Event Logging (Event Logging) – Win32 apps.
Where and how to install the Add-on
Universal Forwarder
- On UF, you have to install and configure Inputs for Splunk Add-on for Windows.
- How to configure the Inputs? Read below
- You can use the Deployment Server to install and configure the same configuration of Splunk Add-on for Windows on multiple Windows and Active Directory Servers.
– Read more about Deployment Server
– Reference – Install the Splunk Add-on for Windows with Forwarder Management
Heavy Forwarder
- If your data is flowing from Universal Forwarder to a Heavy Forwarder then you have to install the Splunk Add-on for Windows on your Heavy Forwarder.
- Note that you do not have to make any configuration on Heavy Forwarder.
Indexers
- If your data is flowing from Universal forwarder to Indexers directly, then you have to install the Splunk Add-on for Windows on Indexers.
- Note there is no need to make any configuration on Indexers.
Search Head
- Install the Splunk Add-on for Windows on the Search Head for field extraction.
- Note that configuration is not needed on the Search Head.
References
- Install the Splunk Add-on for Windows
- What a Splunk App for Windows Infrastructure deployment looks like
How to configure the Add-on
Follow the below steps to configure the inputs:
- $SPLUNK_HOME/etc/apps/Splunk_TA_Windows
($SPLUNK_HOME/etc/deplotment-apps/Splunk_TA_Windows for Deployment Server) - Create a local directory, if it does not exist already.
- Copy inputs.conf file from the default directory into the local directory.
- Edit the inputs.conf from the local directory.
- Add/update the disabled property for any stanza to enable or disable data collection for the different stanza.
- Add the index parameter in all the stanza to collect the data in a specific index.
(Recommended index names are wineventlog, windows, and msad)- What index to choose for which Input stanza?
– See Table A in Download and configure the Splunk Add-on for Windows version 6.0.0 or later
- What index to choose for which Input stanza?
References
How to visualize/understand the data
Splunk App for Windows Infrastructure
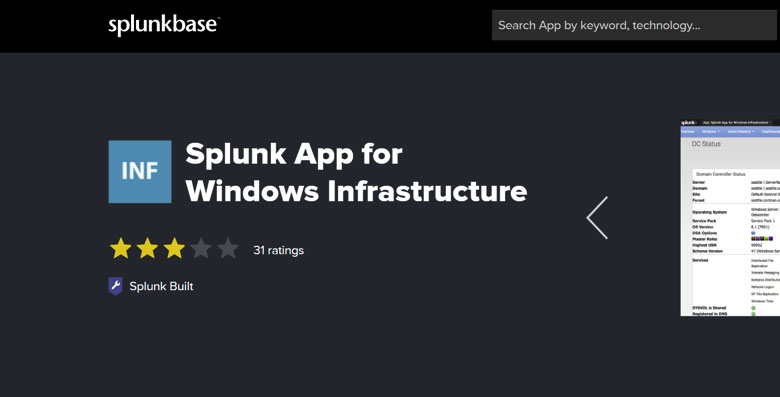
The Splunk App for Windows Infrastructure is a very good way to see your Windows and AD data. The App is created by Splunk.
Download | Documentation
Install
- You only have to install this App on the Search Head. Download the App from Splunkbase and install it on the Search head.
- Download and install Splunk Supporting Add-on for Active Directory.
- Enable proper roles for the user.
- In the system bar, click Settings > Access controls.
- Click Users.
- Click the user that will run the application. Splunk Enterprise displays the information page for the user.
- In the Assign to roles section, in the Available roles column, click winfra-admin role. The role moves from the Available roles to the Selected roles column.
- Click Save.
- Follow the steps for all the users you want to give access to use the Windows Infrastructure App.
References

Configuration
You have to follow the step-by-step wizard within the App to configure the App.
Navigate to Splunk UI and Open the Splunk App for Windows Infrastructure.
References
MS Windows AD Objects
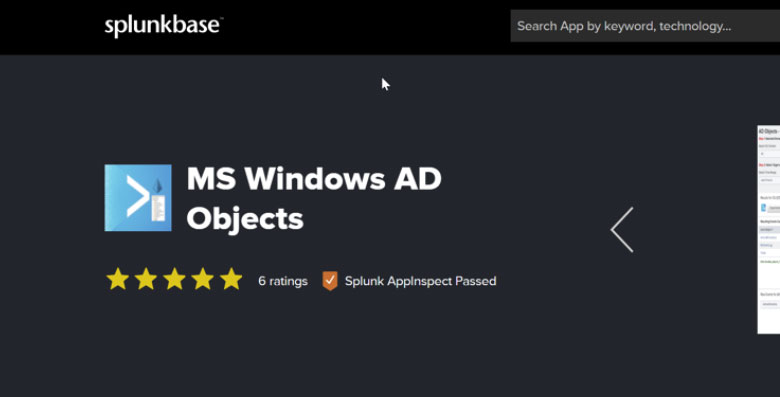
The MS Windows AD Objects App is another good App to visualize the data. You can use it with the Windows Infrastructure App. The MS Windows AD Objects App will give a better option to audit admin activities in AD and Windows.
Download | Documentation
Install
You only have to install this App on the Search Head.
Download the App from Splunkbase and install it on the Search Head.
You must enable the below inputs on the Splunk Add-on for Windows on all the AD servers to make the App work. (See How to configure the Add-on? )
- [admon://default]
- disabled = 0
- monitorSubtree = 1
- baseline = 1
- index=msad
References
Configuration
Follow the step-by-step wizard within the App for configuration.
Navigate to Splunk UI and Open the MS Windows AD Objects App.
Reference
How to get alerts related to events occurring on the Windows Server or on the Active Directory
Here I’ve added some of the examples (including search queries) that may give you a great start for your use-cases with Windows/Active Directory and Splunk.
1. Windows – Alert on Firewall changes on Windows Servers
This alert will tell you if there have been any firewall related changes on any of the Windows servers.
Query
(index=wineventlog OR index=windows OR index=msad) sourcetype=”XmlWinEventLog” source=”XmlWinEventLog:Security” EventCode=4950 | table host, EventCode, ProfileChanged, SettingType, SettingValue
Alert Type – Scheduled
TimeRange – Last 60 Minutes
Cron Expression – 15 * * * *
2. AD – Password change outside working hours
This alert will trigger if someone tried to change the AD password outside the working hours.
The outside Working Hours is defined as “Saturday, Sunday and any day before 6 AM and after 7 PM”. Though you can modify the query here to change the definition of outside working hours.
Query
(index=windows OR index=wineventlog OR index=msad) source=”WinEventLog:Security” EventCode IN (628, 4742, 627, 4723)
| eval date_wday = strftime(_time, “%A”), date_hour = tonumber(strftime(_time, “%H”)) | where date_wday=”Saturday” OR date_wday=”Sunday” OR date_hour<6 OR date_hour>19 | table _time, user, Account_Domain, Account_Name, msad_action, action, Password_Last_Set, EventCode, EventCodeDescription
Alert Type – Scheduled
TimeRange – Last 24 Minutes
Cron Expression – 07 * * * *
3. AD – Alert to show any authority changes in AD privilege
This alert will trigger when there is any privilege escalation (User added/removed to/from a group) on AD.
Query
(index=windows OR index=msad OR index=wineventlog) EventCode IN (4728, 4729) | table host, change_action, Group_Name, member, EventCodeDescription
Alert Type – Scheduled
TimeRange – Last 60 Minutes
Cron Expression – 5 * * * * (Runs every hour)
4. AD – User Modification
This alert will trigger when there is any user modification on AD, that includes any user created, deleted, enabled and disabled.
Query
(index=windows OR index=msad OR index=wineventlog) source=”WinEventLog:Security” EventCode IN (4722, 4725, 4720, 4726) user!=*$ | table _time, host, user, name, EventCode | rename subject as Action
Alert Type – Scheduled
Timerange – Last 5 Minutes
Cron Expression – */5 * * * * (Runs every 5 minutes)
Happy Splunking!
Written by Usama Houlila.
Any questions, comments, or feedback are appreciated! Leave a comment or send me an email to uhoulila@newtheme.jlizardo.com for any questions you might have.